The popular initializers include RandomNormal distribution function, trancated normal distribution function, GlorotNormal function, HeNormal function and others. This example code show what are these functions and display the probability density functions of these initializers for my reference.
Code:
import numpy as np
import matplotlib.pyplot as plt
from scipy.stats import norm
x = np.linspace(-10,10,500)
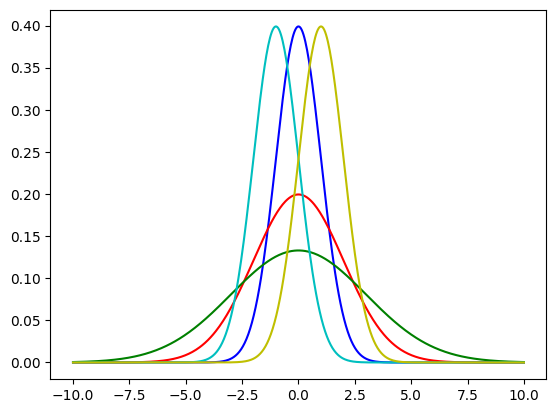
#default RandomNormal(mean=0.0, stddev=0.05, seed=None)
# pdf with different loc and scale values
y1=norm.pdf(x)
y2=norm.pdf(x,loc=0,scale=2)
y3=norm.pdf(x,loc=0,scale=3)
y4=norm.pdf(x,loc=-1,scale=1)
y5=norm.pdf(x,loc=1,scale=1)
z1=norm.rvs(size=5) #random number generation
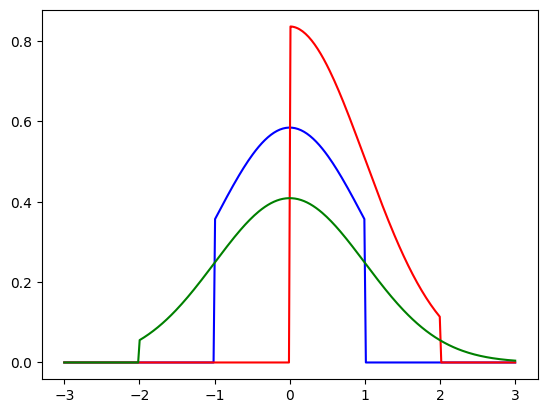
#truncated normal distribution: TruncatedNormal(mean=0.0, stdev=1.0)
from scipy.stats import truncnorm
x = np.linspace(-3,3,300)
a1,b1 = -1, 1
a2,b2 = 0, 2
a3,b3 = -2, 3
y1=truncnorm.pdf(x,a1,b1)
y2=truncnorm.pdf(x,a2,b2)
y3=truncnorm.pdf(x,a3,b3)
z1=truncnorm.rvs(a1,b1,size=5)
plt.plot(x,y1,'b')
plt.plot(x,y2,'r')
plt.plot(x,y3,'g')
plt.show()
#--------------------------------
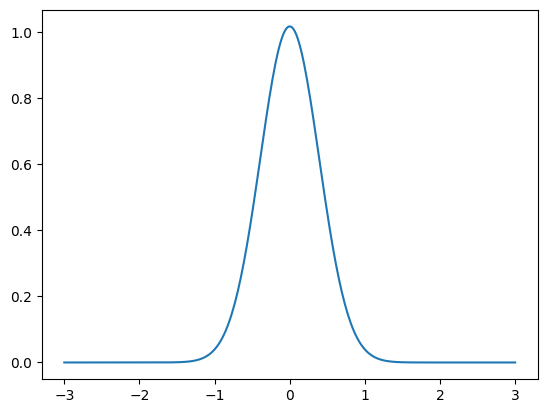
#GlorotNormal(seed=None)
fan_in,fan_out = 10,3 #fan_in:number of input units;#fan_out:the number of output units
stddev=np.sqrt(2/(fan_in+fan_out))
y=norm.pdf(x,loc=0,scale=stddev)
plt.plot(x,y)
plt.show()
#--------------------------------
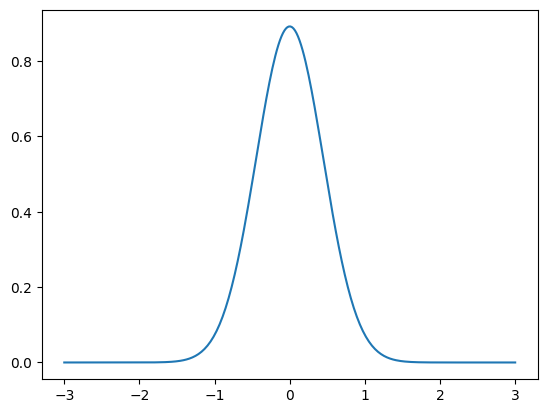
#HeNormal(seed=None)
fan_in = 10 #fan_in:number of input units
stddev=np.sqrt(2/(fan_in))
y=norm.pdf(x,loc=0,scale=stddev)
plt.plot(x,y)
plt.show()