Example code for developing a regression model with keras. It can also answer following questions:
- How to remove constant columns?
- How to normalize variables with sklearn?
- How to remove columns with too many missing values?
Table of Contents
Prepare data
Read data
import numpy as np
import pandas as pd
import matplotlib.pyplot as plt
from sklearn.model_selection import train_test_split
# create range of monthly dates
download_dates = pd.date_range(start='2019-01-01', end='2020-01-01', freq='MS')
# URL from Chrome DevTools Console
base_url = ("https://climate.weather.gc.ca/climate_data/bulk_data_e.html?format=csv&"
"stationID=51442&Year={}&Month={}&Day=7&timeframe=1&submit=Download+Data") # add format option to year and month
# create list of remote URL from base URL
list_of_url = [base_url.format(date.year, date.month) for date in download_dates]
# download and combine multiple files into one DataFrame
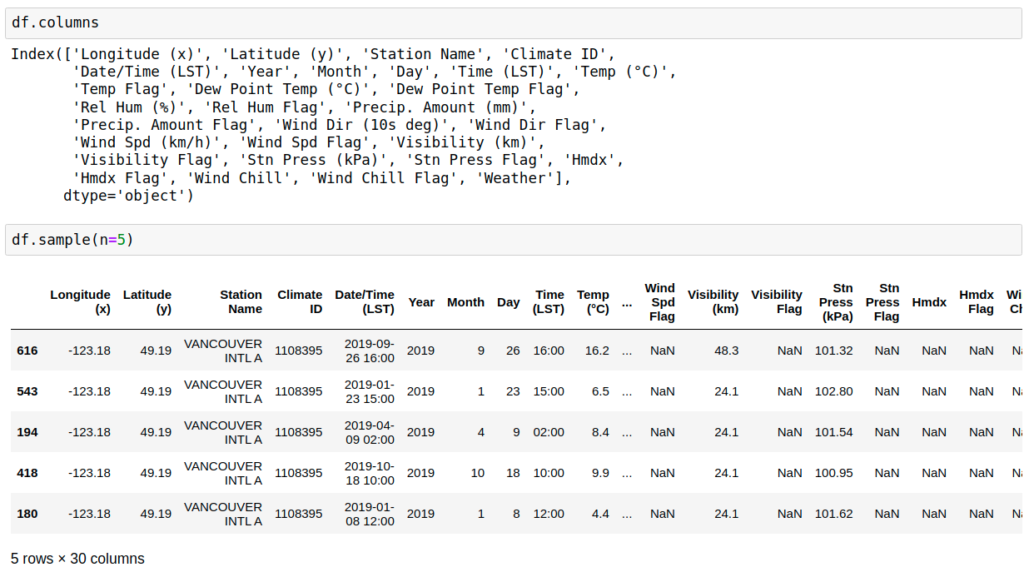
df = pd.concat((pd.read_csv(url) for url in list_of_url))
How to remove constant columns?
data = df.loc[:, (df != df.iloc[0]).any()]

Deleted 4 columns:
'Longitude (x)', 'Latitude (y)', 'Station Name', 'Climate ID',
How to remove columns with too many missing values?
data=data[data.columns[data.isnull().mean() < 0.9]]
Remove columns with >=90% missing data. Keep columns with <90% missing data.

After these 2 steps, the following 17 columns are removed.

keepcolumns=['Temp (°C)','Dew Point Temp (°C)', 'Rel Hum (%)','Stn Press (kPa)']
data=data[keepcolumns]
Develope regression model
For example, we use temperature, dew point temperature, and station pressure to predict relative humidity (9504 rows). In fact, there is a precisely formulated nonlinear relationship between them.
load machine learning packages and seperate data into predictors and predictant
# Import necessary modules
from sklearn.model_selection import train_test_split
from sklearn.metrics import mean_squared_error
from math import sqrt

# Keras specific
import keras
from keras.models import Sequential
from keras.layers import Dense
predictors=['Temp (°C)','Dew Point Temp (°C)', 'Stn Press (kPa)']
predictand=['Rel Hum (%)']
X = data[predictors].values
y = data[predictand].values
X_train, X_test, y_train, y_test = train_test_split(X, y, test_size=0.30, random_state=40)
Nomalize
# from sklearn.preprocessing import MinMaxScaler
# from sklearn.preprocessing import minmax_scale
# from sklearn.preprocessing import MaxAbsScaler
from sklearn.preprocessing import StandardScaler
# from sklearn.preprocessing import RobustScaler
# from sklearn.preprocessing import Normalizer
# from sklearn.preprocessing import QuantileTransformer
# from sklearn.preprocessing import PowerTransformer
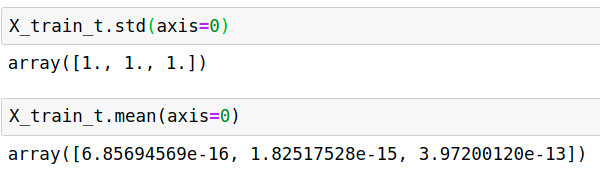
transformer = StandardScaler().fit(X_train)
X_train_t=transformer.transform(X_train)
X_test_t =transformer.transform(X_test)
ytransformer = StandardScaler().fit(y_train)
y_train_t=ytransformer.transform(y_train)
y_test_t =ytransformer.transform(y_test)
Regression Model
# Define model
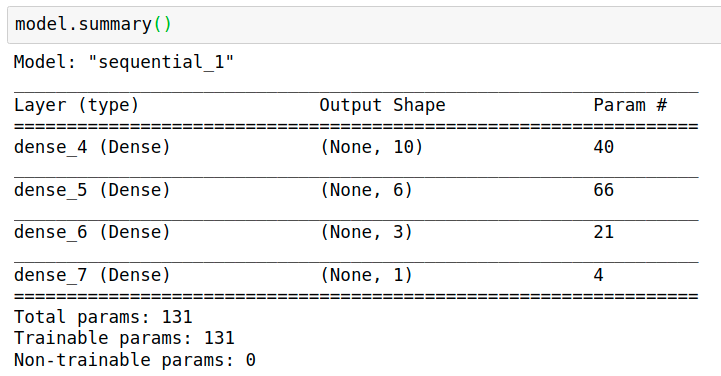
model = Sequential()
model.add(Dense(10, input_dim=3, activation= "relu"))
model.add(Dense(6, activation= "relu"))
model.add(Dense(3, activation= "relu"))
model.add(Dense(1))
model.compile(loss= "mean_squared_error" , optimizer="adam", metrics=["mean_squared_error"])
model.fit(X_train, y_train, epochs=20)
pred_train= model.predict(X_train_t)
print(np.sqrt(mean_squared_error(y_train_t,pred_train)))

pred= model.predict(X_test_t)
print(np.sqrt(mean_squared_error(y_test_t,pred)))
0.05140057822494931
0.053104034408276886