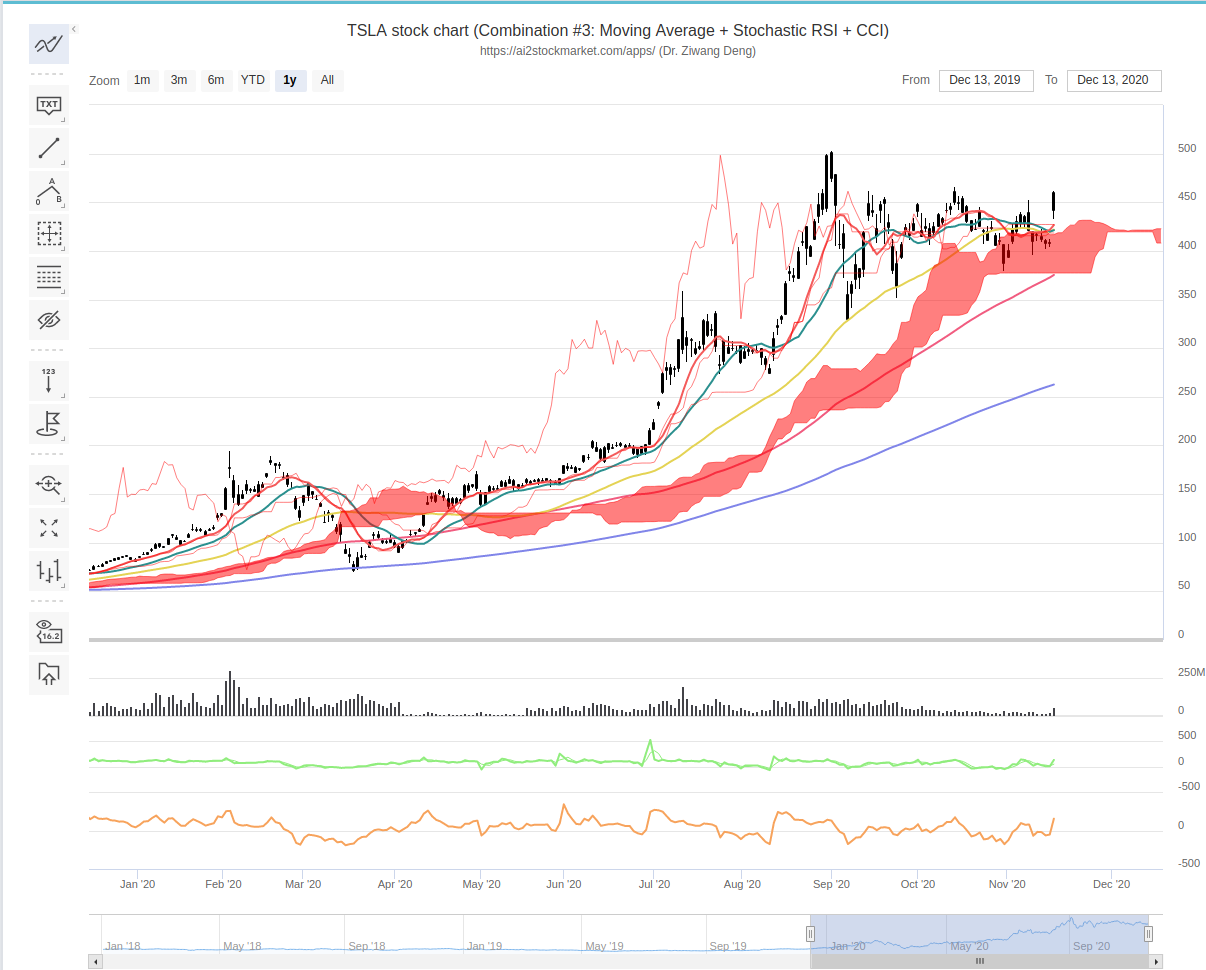
The following example shows you how to draw multiple subplots with different widths and heights. It also tells you the answers to some other questions. How to do technical analysis of a stock? How to draw double y-axis plot? How to set height of a subplot? import numpy as np import talib import emoji import ..
Category : NASDAQ

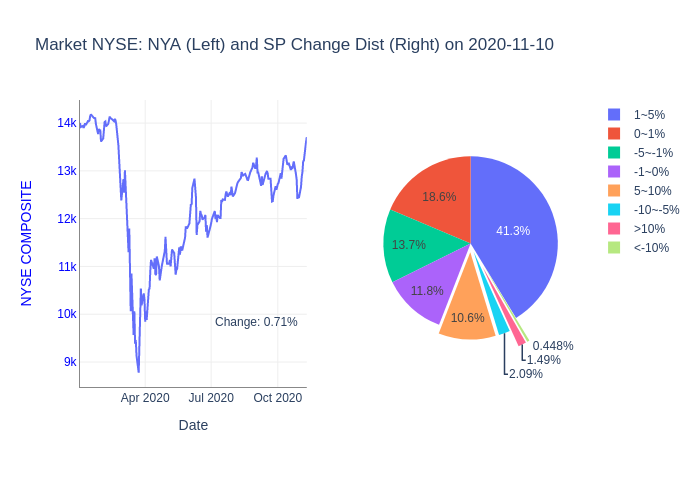
Market Summary NYSE and NASDAQ composite indexes fell and TSX composite index rose 55% of the stocks on NYSE market rose and 43% of the stocks fell 48% of the stocks on NASDAQ market rose and 50% of the stocks fell 49% of the stocks on TSX market rose and 43% of the stocks fell ..

Market summary S&P, NASDAQ, DOW, glold and oil rose 82.4% of the stocks on NYSE market rose 72.1% of the stocks on NASDAQ market rose 66.2% of the stocks on TSX market rose 😷🧼🏡😷🧼🏡😷🧼🏡😷🧼🏡 NYSE Summary Based on data of 2012 stocks traded on NYSE 82.4% stocks rose,16.0% stocks fell 15.7% stocks jumped more than ..
83% of the stocks of NYSE rose and 15% of the stocks fell 74% of the stocks of NASDAQ rose and 24% of the stocks fell 65% of the stocks of TSX rose and 26% of the stocks fell 😷🧼🏡😷🧼🏡😷🧼🏡😷🧼🏡😷🧼🏡 NYSE Summary Based on data of 2012 stocks traded on NYSE 82.7% stocks rose,15.2% stocks ..
Following the decline in Asian and European stock markets, the US and Canadian stock markets fell. Today, 81%, 71% and 63% of stocks on the New York Stock Exchange, Nasdaq and Toronto Stock Exchange markets have fallen, respectively. 😷🧼🏡😷🧼🏡😷🧼🏡😷🧼🏡 NYSE Summary Based on data of 2010 stocks traded on NYSE 17.7% stocks rose,80.5% stocks fell ..
47% stocks of NYSE rose,51% fell 52% stocks of NASDAQ rose,45% fell 65% stocks of TSX rose,28% fell 😷🧼🏡 Based on data of 2011 stocks traded on NYSE 46.9% stocks rose,50.6% stocks fell 3.5% stocks jumped more than 5%,3.6% stocks dropped more than 5% 41.4% stocks swang between -1% and 1% NYSE top 10 stocks: ..

90% stocks among the 2011 active NYSE stocks rose,28% fell 62% stocks among the 2145 active NASDAQ stocks rose,36% fell 52% stocks among the 1184 active TSX stocks rose,42% fell 😷🧼🏡 NYSE Summary Based on data of 2011 stocks traded on NYSE 69.4% stocks rose,28.0% stocks fell 12.0% stocks jumped more than 5%,2.5% stocks dropped ..
76% of NYSE stocks rose, 38% soared 🚀more than 5% and 21% soared🚀 more 10%; 69% of NASDAQ stocks rose, 31% soared 🚀more than 5%,14% soared more than 10%; 61% of TSX stocks rose, 19% soared 🚀more than 5% and 8% soared 🚀more than 10%. Market Summary Based on data of 2015 stocks traded on ..
Today’s Market Summary 39.0% of stocks on NYSE rose, 59.0% fell; 34.5% of Nasdaq stocks rose,64.0% fell;45.1% of stocks on TSX rose,47.1% fell. The number of stocks that have fallen more than 5% is small. Based on data of 2012 stocks traded on NYSE 39.0% stocks rose,59.0% stocks fell 2.8% stocks jumped more than 5%,4.4% ..
Today’s U.S. and Canada Stock market summary 83% of NASDAQ stocks, 75% of NYSE stocks and 78% of TSX stocks rose today. Based on data of 2010 stocks traded on NYSE 83.3% stocks rose,15.5% stocks fell 15.3% stocks jumped more than 5%,1.1% stocks dropped more than 5% 26.1% stocks swang between -1% and 1% Based ..