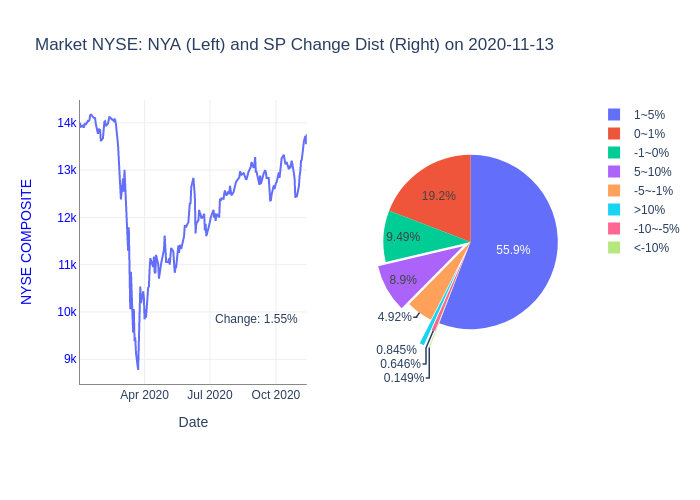
- 83% of the stocks of NYSE rose and 15% of the stocks fell
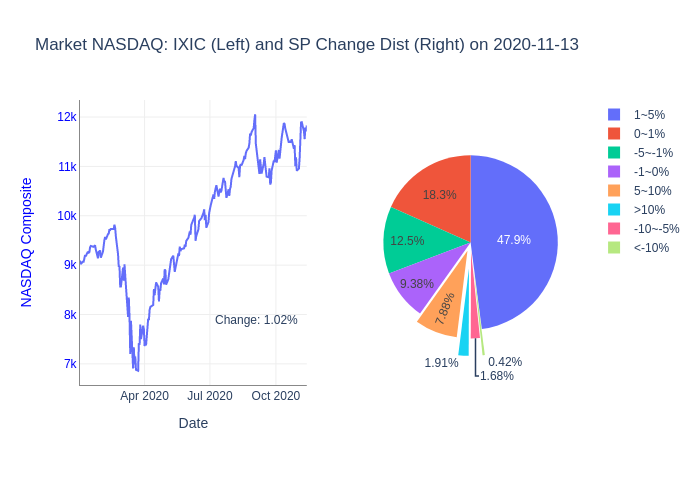
- 74% of the stocks of NASDAQ rose and 24% of the stocks fell
- 65% of the stocks of TSX rose and 26% of the stocks fell
Table of Contents
NYSE Summary
Based on data of 2012 stocks traded on NYSE
- 82.7% stocks rose,15.2% stocks fell
- 9.6% stocks jumped more than 5%,0.8% stocks dropped more than 5%
- 28.7% stocks swang between -1% and 1%
NYSE top 10 stocks:
Top Moneyflow:💸:
Most active:🔥:
Top gainers:🚀:
Golden Crosses:🇯🇪 :
😷🧼🏡😷🧼🏡😷🧼🏡😷🧼🏡😷🧼🏡
NASDAQ Summary
Based on data of 2144 stocks traded on NASDAQ
- 73.9% stocks rose,23.9% stocks fell
- 9.8% stocks jumped more than 5%,2.1% stocks dropped more than 5%
- 27.7% stocks swang between -1% and 1%
NASDAQ top 10 stocks:
Top Moneyflow:💸:
Most active:🔥:
Top gainers:🚀:
Golden Crosses:🇯🇪 :
😷🧼🏡😷🧼🏡😷🧼🏡😷🧼🏡😷🧼🏡
TSX Summary
Based on data of 1152 stocks traded on TSX
- 65.2% stocks rose,26.2% stocks fell
- 4.7% stocks jumped more than 5%,3.0% stocks dropped more than 5%
- 45.1% stocks swang between -1% and 1%
TSX top 10 stocks:
Top Moneyflow:💸:
Most active:🔥:
Top gainers:🚀:
ACQ.TO 11%
CIA.TO 10%
WPRT.TO 9%
TRQ.TO 8%
IBG.TO 8%
MAXR.TO 7%
OVV.TO 7%
ITP.TO 7%
CLS.TO 6%
IFC.TO 5%
Golden Crosses:🇯🇪 :
😷🧼🏡😷🧼🏡😷🧼🏡😷🧼🏡😷🧼🏡
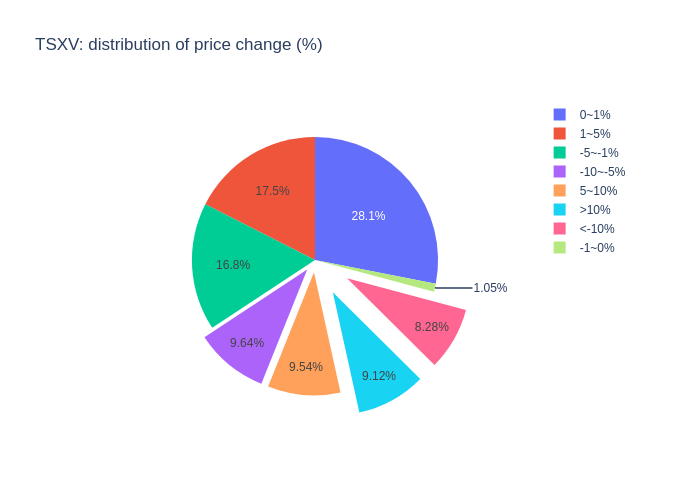
TSXV Summary
Based on data of 954 stocks traded on TSXV
- 37.4% stocks rose,35.7% stocks fell
- 18.0% stocks jumped more than 5%,17.9% stocks dropped more than 5%
- 29.1% stocks swang between -1% and 1%
TSXV top 10 stocks:
Top Moneyflow:💸:
Most active:🔥:
Top gainers:🚀:
TLT.V 58%
IGX.V 55%
KMAX.V 44%
EMN.V 39%
KIDZ.V 27%
GBLT.V 27%
ITM.V 25%
HEI.V 22%
GOE.V 20%
EWK.V 19%
Golden Crosses:🇯🇪 :
😷🧼🏡😷🧼🏡😷🧼🏡😷🧼🏡😷🧼🏡
NYSEMKT Summary
Based on data of 245 stocks traded on NYSEMKT
- 57.6% stocks rose,37.6% stocks fell
- 9.4% stocks jumped more than 5%,4.1% stocks dropped more than 5%
- 35.1% stocks swang between -1% and 1%


