Calculating averages or sums is often used in environmental data analysis. This post collects some examples of computing the average (or sum) of xarray data based on my program for processing global climate change datasets. The example show how to calculate monthly mean from daily data. How to calculate spatial average over a sub region and how to calculate annual mean time series from spatial/temporal data.
Table of Contents
Data
import xarray as xr
fn = 'pr_day_MIROC5_rcp60_r1i1p1_EWEMBI_20410101-20501231.nc4'
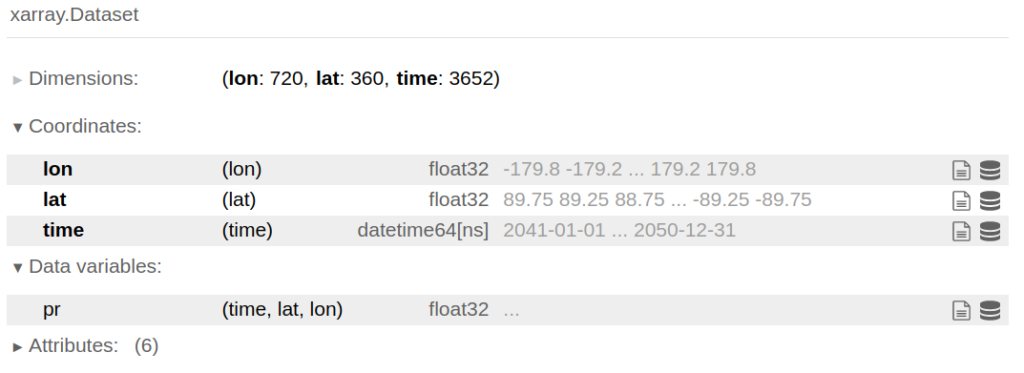
ds=xr.open_dataset(fn)
ds
Spatial average over an area
Crop data
#define the area
min_lon = -100
min_lat = 35
max_lon = -75
max_lat = 45
#select data for the area
#because the data are stored from north to south, so lat=slice(max_lat,min_lat),from maximum to minimum
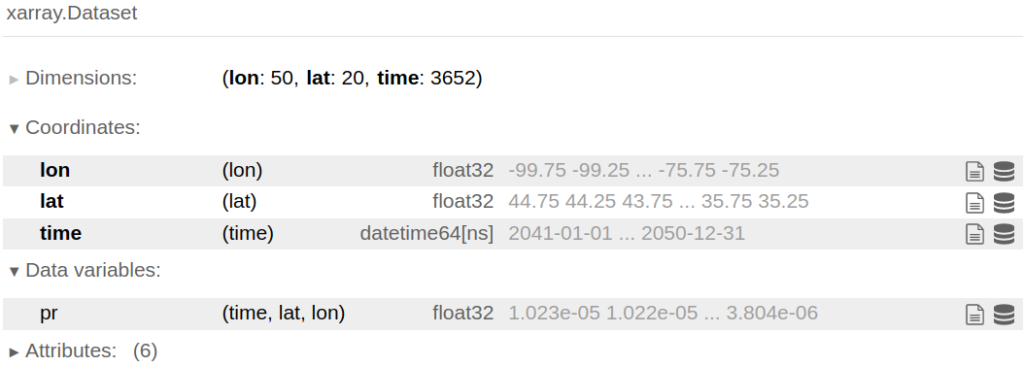
cropped_ds = ds.sel(lat=slice(max_lat,min_lat), lon=slice(min_lon,max_lon))
cropped_ds
Average over the area to get spatial averaged daily values
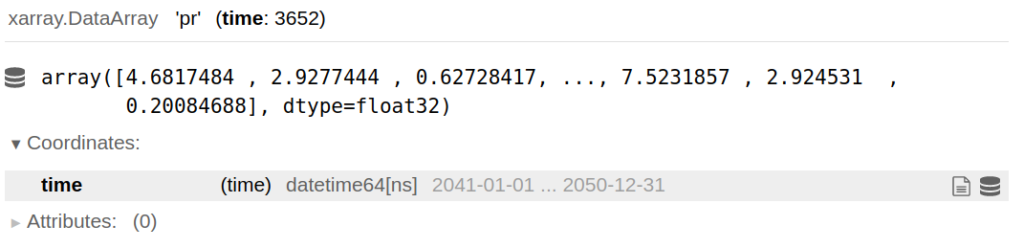
Here, the data is daily precipitation rate, convert to daily precipitation amount by factor 3600(seconds)*24(hours). You can average over lat (dim=’lat’) or lon (dim=’lon’).
#average over the area, the dimention includes both lon and lat
pr=cropped_ds['pr'].mean(dim=('lat','lon'))*3600*24
Temporal averages (sum, min, max,…)
Monthly sum from daily data
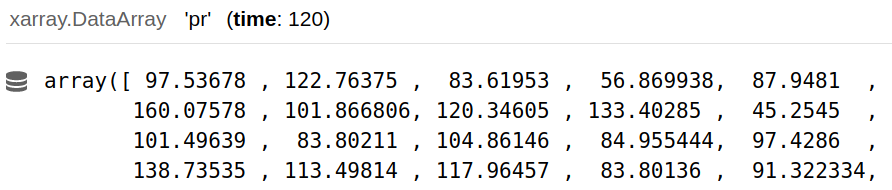
#average over the area, the dimention includes both lon and lat
pr.resample(time='m').sum()
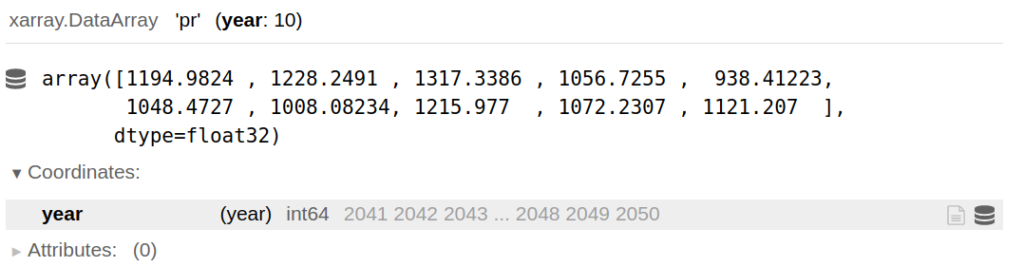
Annual sum from daily data
pr.groupby('time.year').sum()
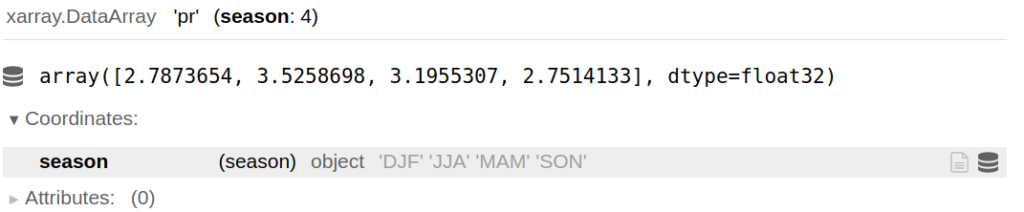
Seasonal mean
pr.groupby('time.season').mean('time')
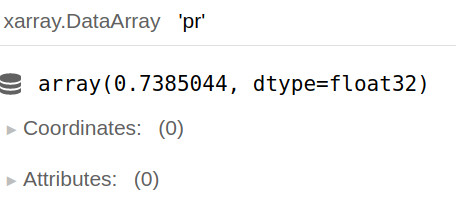
seasonal_mean=pr.groupby('time.season').mean('time')
seasonal_mean.sel(season='JJA') - seasonal_mean.sel(season='DJF')
Original code:
/media/Data1/Climada/isimip3/read_ISIMIP2b_yields.ipynb