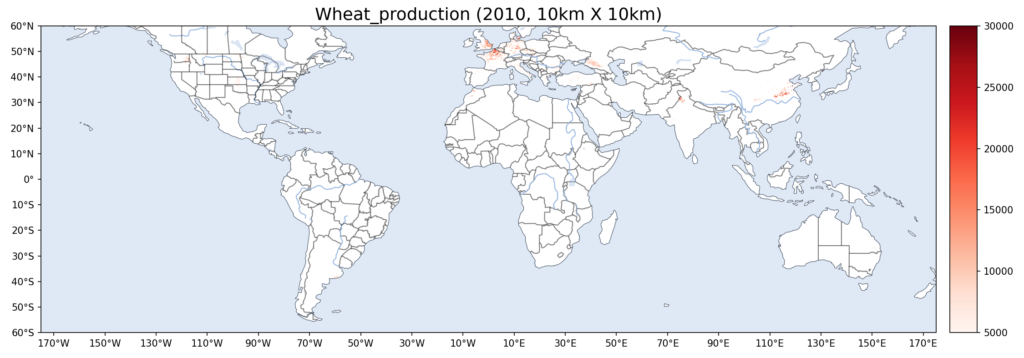
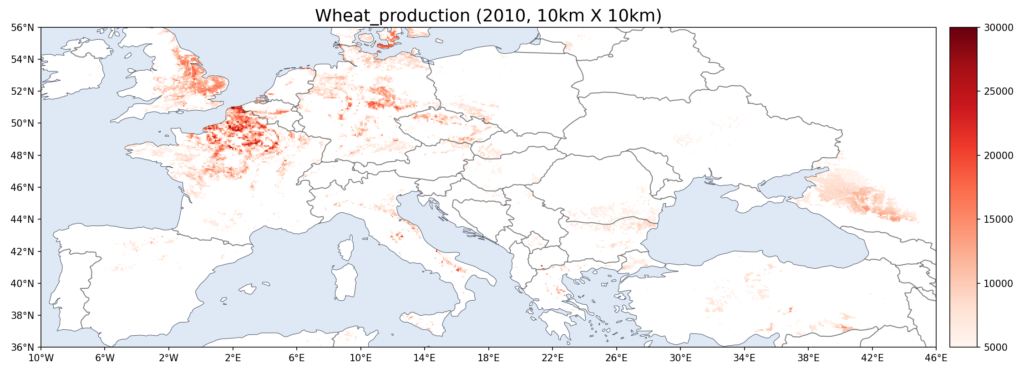
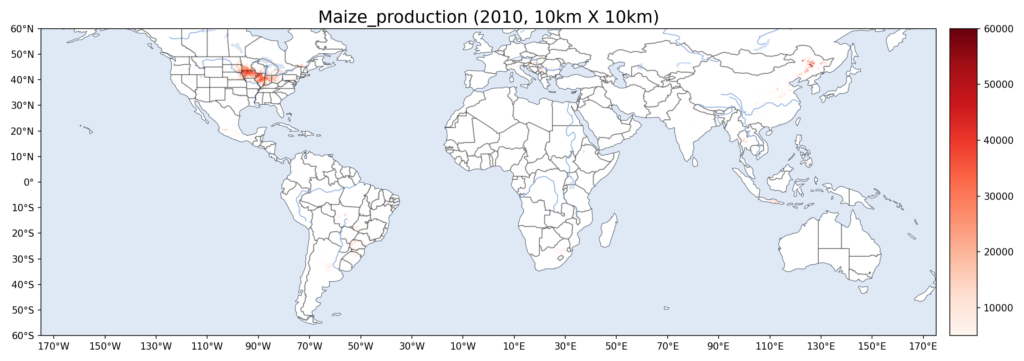
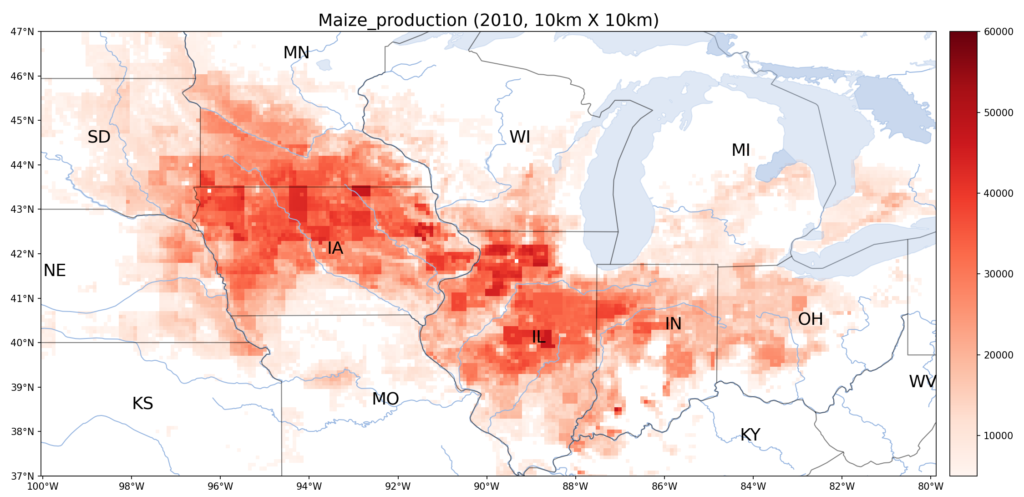
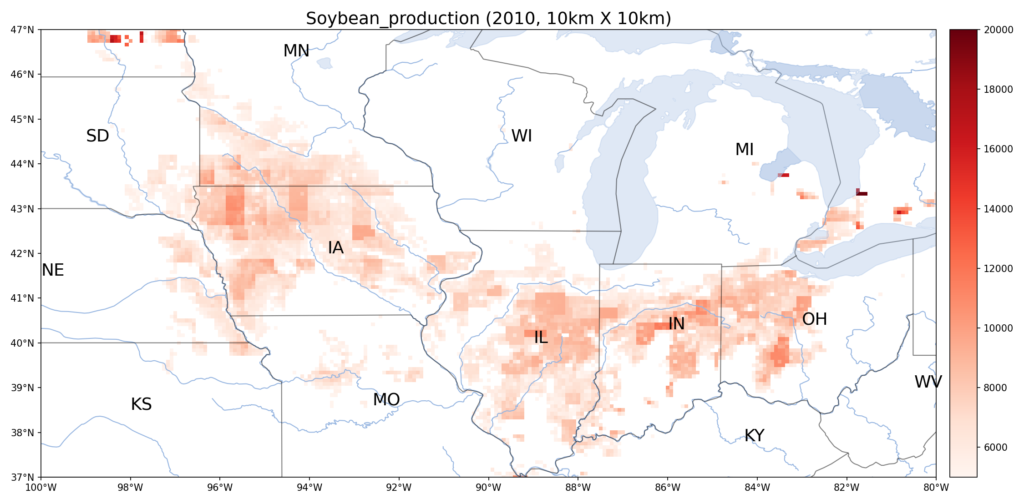
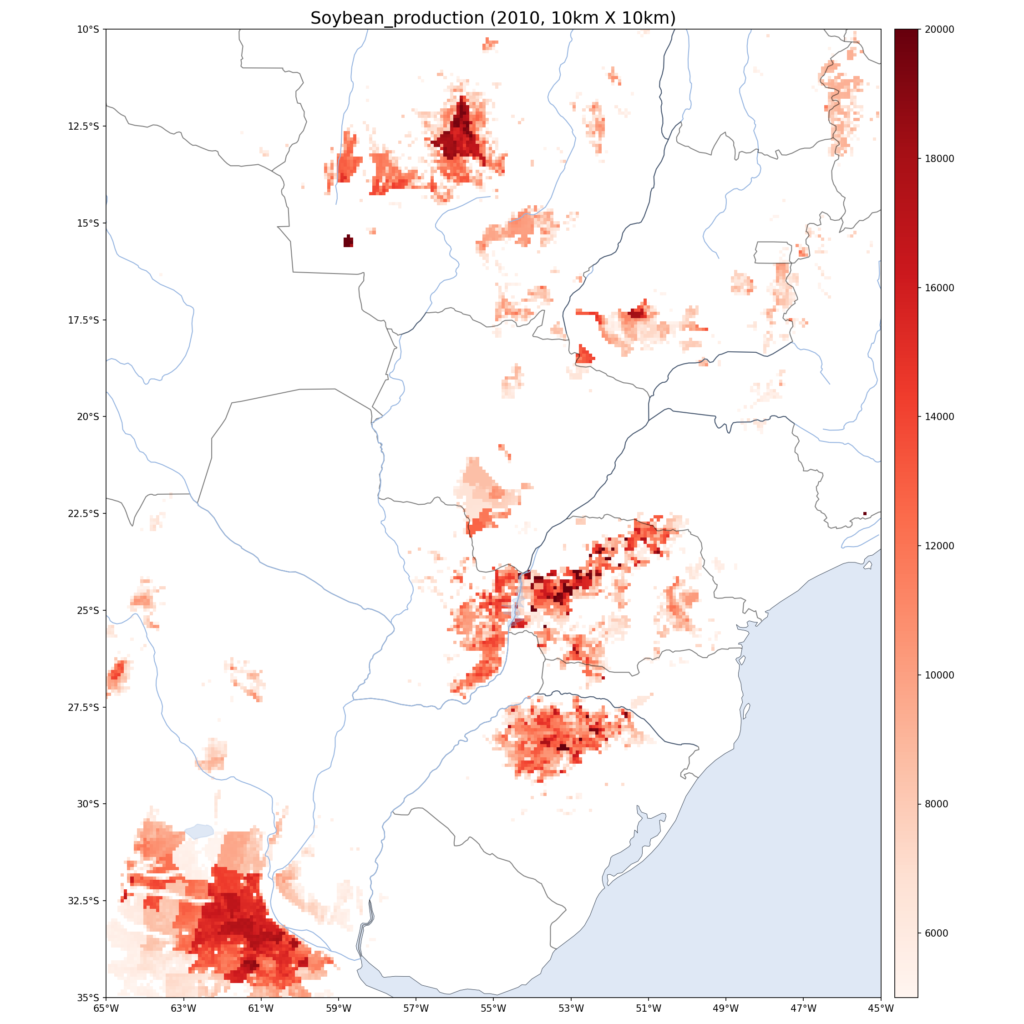
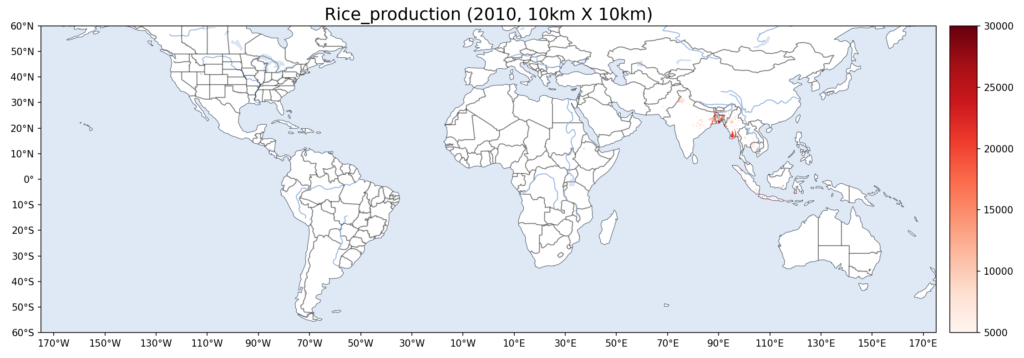
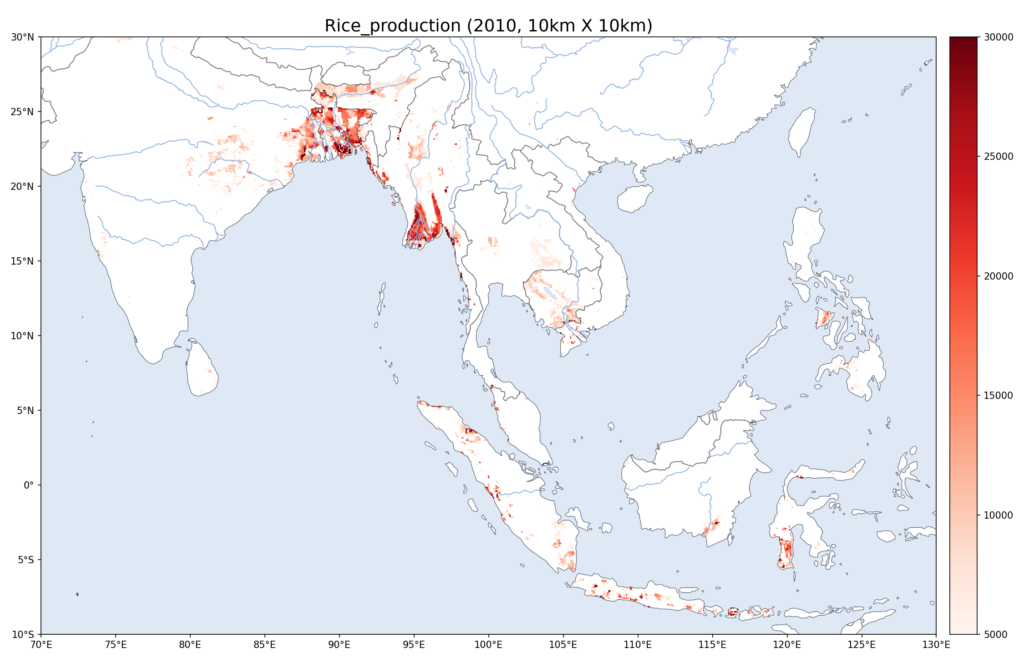
The maps posted here are generated based on SPAM 2010 v2.0 data. These maps are for my own reference only when conducting climate change risk assessment studies. Please do not cite them in any academic research.

The maps posted here are generated based on SPAM 2010 v2.0 data. These maps are for my own reference only when conducting climate change risk assessment studies. Please do not cite them in any academic research.