A comprehensive understanding of the overall situation of the data is the first step in data analysis. The following sample code shows you how to do this simply with pandas. Use of functions columns, keys(),axes,dtypes,info(),describe(),describe(include=object),isna().sum(),nunique(),value_counts(),len,shape,nsmallest(), nlargest(),sample(),head and tail.
Table of Contents
Read data
#dowonload https://github.com/ziwangdeng/Data/blob/main/Vancouver_weather2010to2019_v00.csv
import pandas as pd
df=pd.read_csv('Vancouver_weather2010to2019_v00.csv')
Check column names
df.columns

Index(['Unnamed: 0', 'Longitude (x)', 'Latitude (y)', 'Station Name',
       'Climate ID', 'Date/Time (LST)', 'Year', 'Month', 'Day', 'Time (LST)',
       'Temp (°C)', 'Temp Flag', 'Dew Point Temp (°C)', 'Dew Point Temp Flag',
       'Rel Hum (%)', 'Rel Hum Flag', 'Precip. Amount (mm)',
       'Precip. Amount Flag', 'Wind Dir (10s deg)', 'Wind Dir Flag',
       'Wind Spd (km/h)', 'Wind Spd Flag', 'Visibility (km)',
       'Visibility Flag', 'Stn Press (kPa)', 'Stn Press Flag', 'Hmdx',
       'Hmdx Flag', 'Wind Chill', 'Wind Chill Flag', 'Weather'],
      dtype='object')

df.keys()
Index(['Unnamed: 0', 'Longitude (x)', 'Latitude (y)', 'Station Name',
       'Climate ID', 'Date/Time (LST)', 'Year', 'Month', 'Day', 'Time (LST)',
       'Temp (°C)', 'Temp Flag', 'Dew Point Temp (°C)', 'Dew Point Temp Flag',
       'Rel Hum (%)', 'Rel Hum Flag', 'Precip. Amount (mm)',
       'Precip. Amount Flag', 'Wind Dir (10s deg)', 'Wind Dir Flag',
       'Wind Spd (km/h)', 'Wind Spd Flag', 'Visibility (km)',
       'Visibility Flag', 'Stn Press (kPa)', 'Stn Press Flag', 'Hmdx',
       'Hmdx Flag', 'Wind Chill', 'Wind Chill Flag', 'Weather'],
      dtype='object')
Refer to the 2 dimensions of a DataFrame as axes
df.axes

[RangeIndex(start=0, stop=88392, step=1),
 Index(['Unnamed: 0', 'Longitude (x)', 'Latitude (y)', 'Station Name',
        'Climate ID', 'Date/Time (LST)', 'Year', 'Month', 'Day', 'Time (LST)',
        'Temp (°C)', 'Temp Flag', 'Dew Point Temp (°C)', 'Dew Point Temp Flag',
        'Rel Hum (%)', 'Rel Hum Flag', 'Precip. Amount (mm)',
        'Precip. Amount Flag', 'Wind Dir (10s deg)', 'Wind Dir Flag',
        'Wind Spd (km/h)', 'Wind Spd Flag', 'Visibility (km)',
        'Visibility Flag', 'Stn Press (kPa)', 'Stn Press Flag', 'Hmdx',
        'Hmdx Flag', 'Wind Chill', 'Wind Chill Flag', 'Weather'],
       dtype='object')]
Check data type of each column
df.dtypes
Unnamed: 0               int64
Longitude (x)          float64
Latitude (y)           float64
Station Name            object
Climate ID               int64
Date/Time (LST)         object
Year                     int64
Month                    int64
Day                      int64
Time (LST)              object
Temp (°C)              float64
Temp Flag               object
Dew Point Temp (°C)    float64
Dew Point Temp Flag     object
Rel Hum (%)            float64
Rel Hum Flag            object
Precip. Amount (mm)    float64
Precip. Amount Flag     object
Wind Dir (10s deg)     float64
Wind Dir Flag           object
Wind Spd (km/h)        float64
Wind Spd Flag           object
Visibility (km)        float64
Visibility Flag        float64
Stn Press (kPa)        float64
Stn Press Flag          object
Hmdx                   float64
Hmdx Flag              float64
Wind Chill             float64
Wind Chill Flag        float64
Weather                 object
dtype: object
Display all columns and their data types
df.info()

RangeIndex: 88392 entries, 0 to 88391
Data columns (total 31 columns):
 #   Column               Non-Null Count  Dtype
---  ------               --------------  -----
 0   Unnamed: 0           88392 non-null  int64
 1   Longitude (x)        88392 non-null  float64
 2   Latitude (y)         88392 non-null  float64
 3   Station Name         88392 non-null  object
 4   Climate ID           88392 non-null  int64
 5   Date/Time (LST)      88392 non-null  object
 6   Year                 88392 non-null  int64
 7   Month                88392 non-null  int64
 8   Day                  88392 non-null  int64
 9   Time (LST)           88392 non-null  object
 10  Temp (°C)            58173 non-null  float64
 11  Temp Flag            7 non-null      object
 12  Dew Point Temp (°C)  58159 non-null  float64
 13  Dew Point Temp Flag  21 non-null     object
 14  Rel Hum (%)          58157 non-null  float64
 15  Rel Hum Flag         23 non-null     object
 16  Precip. Amount (mm)  0 non-null      float64
 17  Precip. Amount Flag  25 non-null     object
 18  Wind Dir (10s deg)   58046 non-null  float64
 19  Wind Dir Flag        15 non-null     object
 20  Wind Spd (km/h)      58164 non-null  float64
 21  Wind Spd Flag        16 non-null     object
 22  Visibility (km)      58180 non-null  float64
 23  Visibility Flag      0 non-null      float64
 24  Stn Press (kPa)      58160 non-null  float64
 25  Stn Press Flag       20 non-null     object
 26  Hmdx                 3166 non-null   float64
 27  Hmdx Flag            0 non-null      float64
 28  Wind Chill           2454 non-null   float64
 29  Wind Chill Flag      0 non-null      float64
 30  Weather              26060 non-null  object
dtypes: float64(15), int64(5), object(11)
memory usage: 20.9+ MB
Summarizes some statistical data for all numerical columns
df.describe()

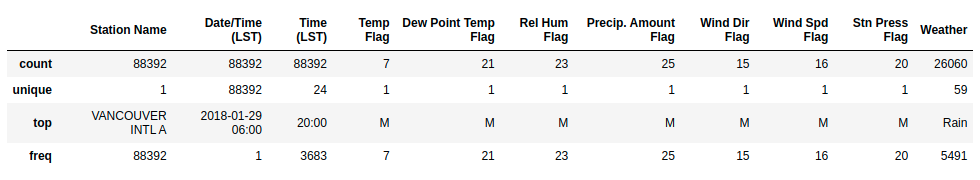
Sisplay some descriptive statistics of object columns
df.describe(include=object)
Check how many missing data in each column
df.isna().sum()
Unnamed: 0                 0
Longitude (x)              0
Latitude (y)               0
Station Name               0
Climate ID                 0
Date/Time (LST)            0
Year                       0
Month                      0
Day                        0
Time (LST)                 0
Temp (°C)              30219
Temp Flag              88385
Dew Point Temp (°C)    30233
Dew Point Temp Flag    88371
Rel Hum (%)            30235
Rel Hum Flag           88369
Precip. Amount (mm)    88392
Precip. Amount Flag    88367
Wind Dir (10s deg)     30346
Wind Dir Flag          88377
Wind Spd (km/h)        30228
Wind Spd Flag          88376
Visibility (km)        30212
Visibility Flag        88392
Stn Press (kPa)        30232
Stn Press Flag         88372
Hmdx                   85226
Hmdx Flag              88392
Wind Chill             85938
Wind Chill Flag        88392
Weather                62332
dtype: int64
Check how many unique values in each column
df.nunique()
Unnamed: 0               744
Longitude (x)              1
Latitude (y)               1
Station Name               1
Climate ID                 1
Date/Time (LST)        88392
Year                      11
Month                     12
Day                       31
Time (LST)                24
Temp (°C)                379
Temp Flag                  1
Dew Point Temp (°C)      393
Dew Point Temp Flag        1
Rel Hum (%)               84
Rel Hum Flag               1
Precip. Amount (mm)        0
Precip. Amount Flag        1
Wind Dir (10s deg)        37
Wind Dir Flag              1
Wind Spd (km/h)           64
Wind Spd Flag              1
Visibility (km)           31
Visibility Flag            0
Stn Press (kPa)          578
Stn Press Flag             1
Hmdx                      11
Hmdx Flag                  0
Wind Chill                16
Wind Chill Flag            0
Weather                   59
dtype: int64
Examine how often specific values occur in a column
df['Weather'].value_counts().head(15)

Rain                 5491
Cloudy               5171
Mostly Cloudy        4303
Mainly Clear         4165
Clear                2408
Fog                  1148
Rain Showers          926
Rain,Fog              826
Snow                  349
Drizzle,Fog           238
Moderate Rain         236
Moderate Rain,Fog     200
Smoke                 114
Drizzle               105
Rain,Drizzle,Fog       55
Name: Weather, dtype: int64
Check how many rows in the data
len(df)
88392
Check the shape of the table
df.shape
(88392, 31)
Check n smallest values of a column
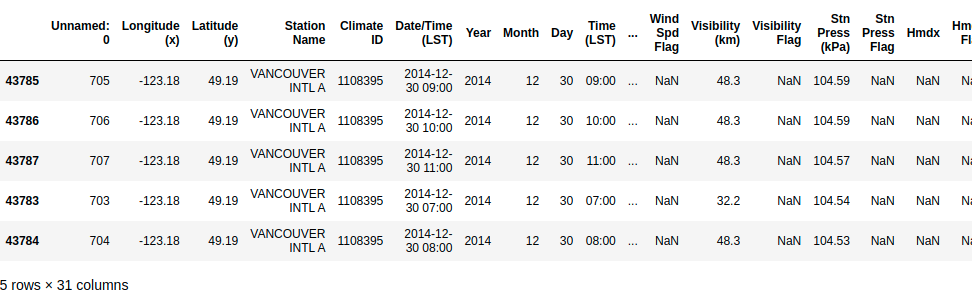
df.nsmallest(5, 'Stn Press (kPa)')
Check n largest values of a column
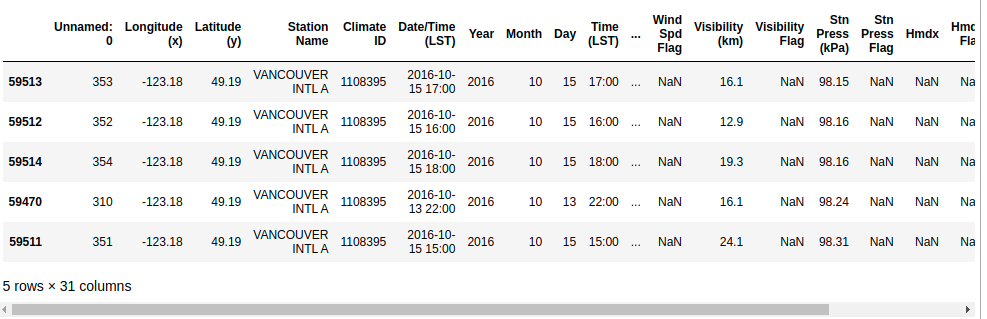
df.nlargest(5, 'Stn Press (kPa)')
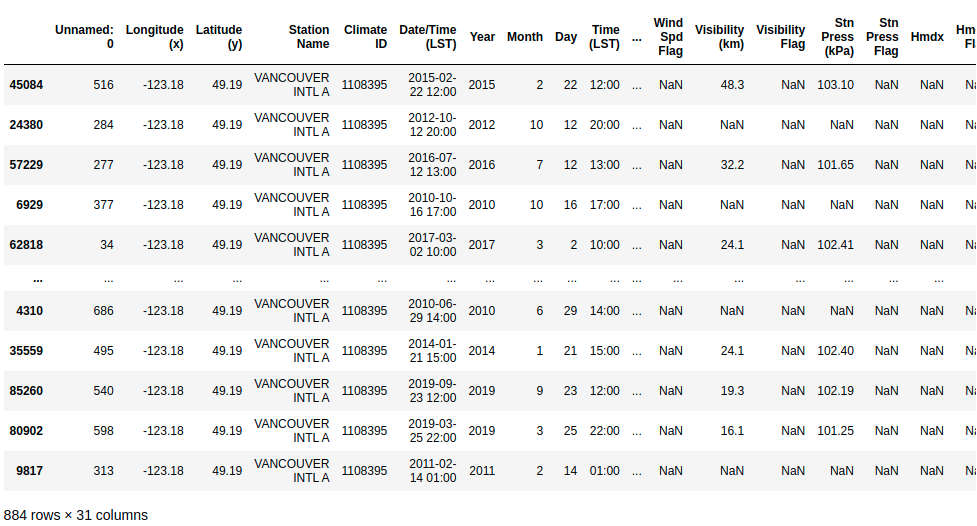
Randomly select fraction of rows
df.sample(frac=0.01)
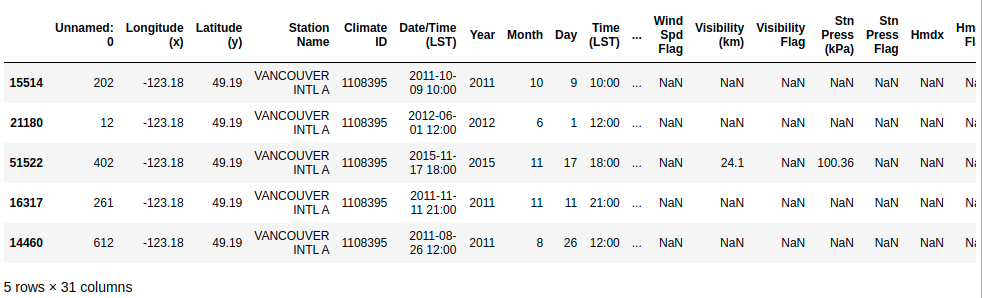
Randomly select n rows
df.sample(n=5)
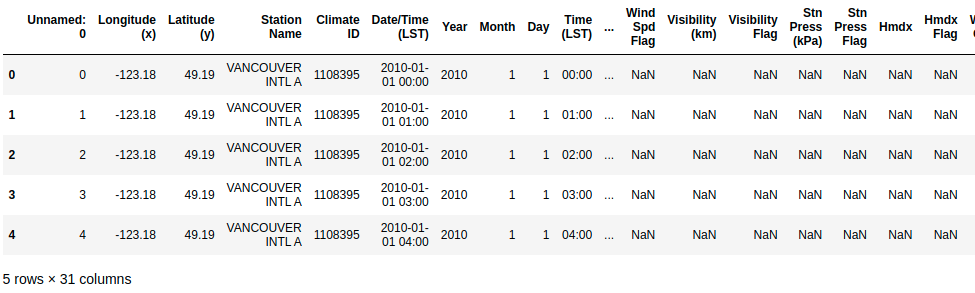
Select first n rows
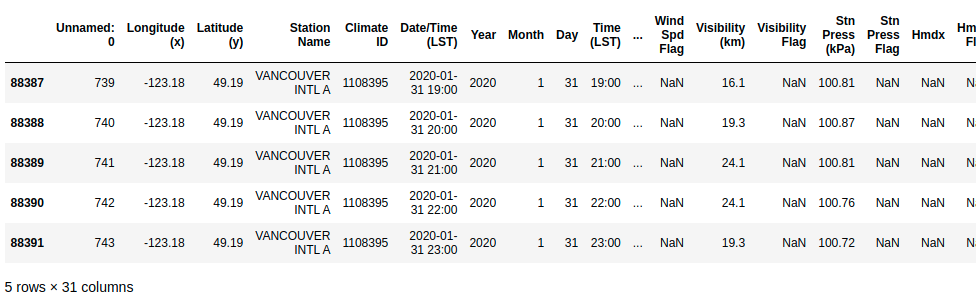
df.head(5)
Select last n rows
df.tail(5)