Example code for log,reciprocal,arcsin ,power transformers of feature-engine. You can find answer to the following question as well:
- How to directly read hourly weather data in Canada from government climate data center?
- How to transform positive variable with LogTransformer?
- How to transform any variable with LogCpTransformer?
- How to transform variable x to 1/x with ReciprocalTransformer?
import numpy as np
import pandas as pd
import matplotlib.pyplot as plt
from sklearn.model_selection import train_test_split

from feature_engine import transformation as vt

# Load dataset
#  create range of monthly dates
download_dates = pd.date_range(start='2019-01-01', end='2020-01-01', freq='MS')

#  URL from Chrome DevTools Console
base_url = ("https://climate.weather.gc.ca/climate_data/bulk_data_e.html?format=csv&"
              "stationID=51442&Year={}&Month={}&Day=7&timeframe=1&submit=Download+Data") #  add format option to year and month

#  create list of remote URL from base URL
list_of_url = [base_url.format(date.year, date.month) for date in download_dates]

#  download and combine multiple files into one DataFrame
df = pd.concat((pd.read_csv(url) for url in list_of_url))
keepcolumns=['Station Name','Longitude (x)', 'Latitude (y)',
       'Date/Time (LST)', 'Temp (°C)','Dew Point Temp (°C)',
       'Rel Hum (%)', 'Wind Spd (km/h)', 'Stn Press (kPa)']
data=df[keepcolumns]

The logarithm to 2 of the variables in the dataset
# transform the data
tf = vt.LogTransformer(variables = ['Stn Press (kPa)', 'Rel Hum (%)'])

# fit the transformer
tf.fit(data)
data_t= tf.transform(data)
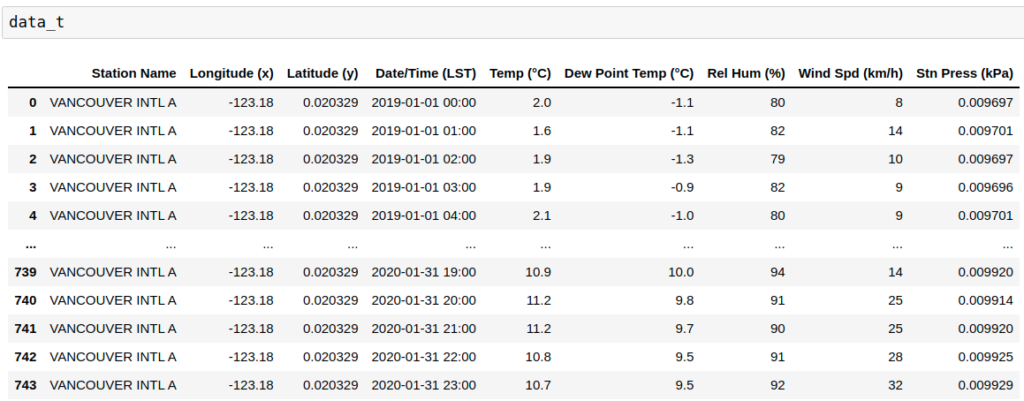
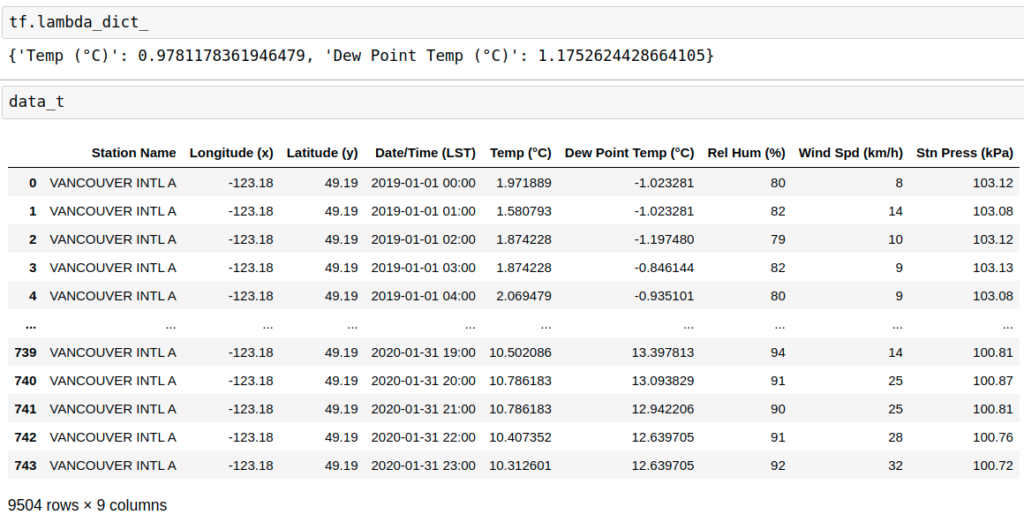
Apply the logarithm to 2 of the variables x using transformation log(x + C), where C is a positive constant.The transformer to detect automatically the quantity “C” that needs to be added to the variable
# set up the variable transformer
tf = vt.LogCpTransformer(variables = ['Temp (°C)','Dew Point Temp (°C)'], C="auto")

# fit the transformer
tf.fit(data)
data_t= tf.transform(data)

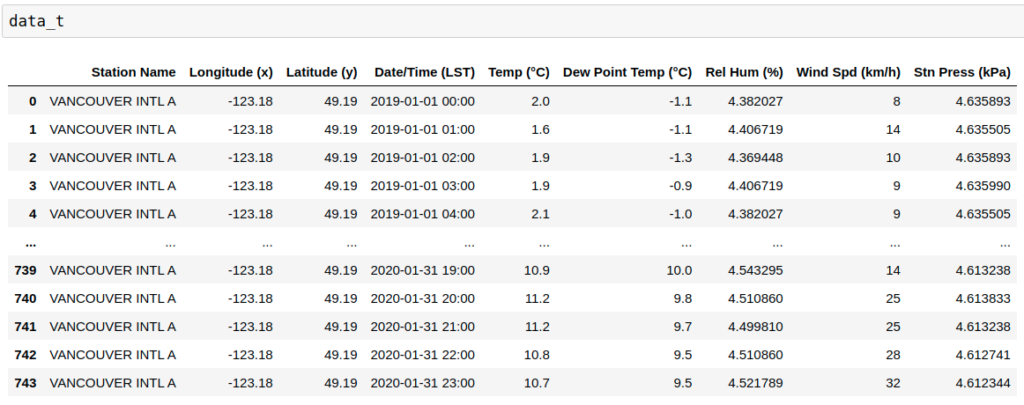
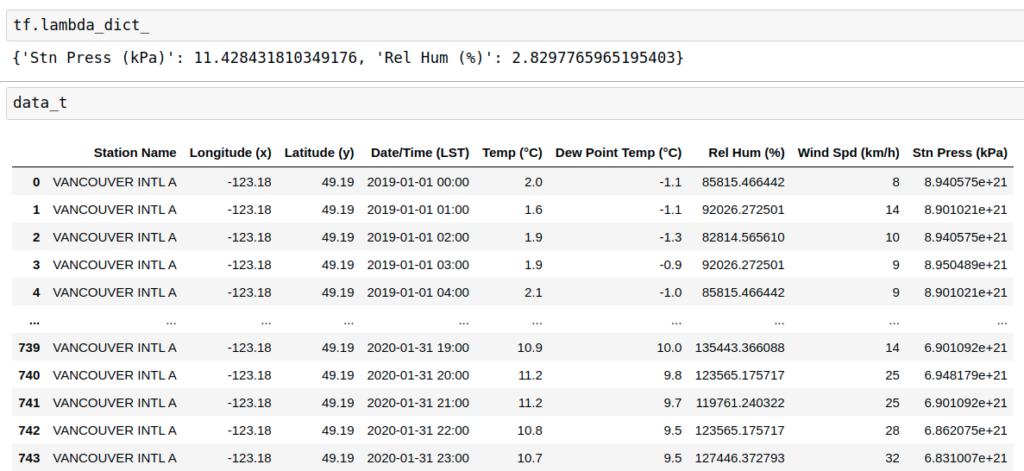
Apply the reciprocal transformation 1 / x to numerical variables.
# set up the variable transformer
tf = vt.ReciprocalTransformer(variables = ['Stn Press (kPa)','Latitude (y)'])

# fit the transformer
tf.fit(data)
data_t= tf.transform(data)
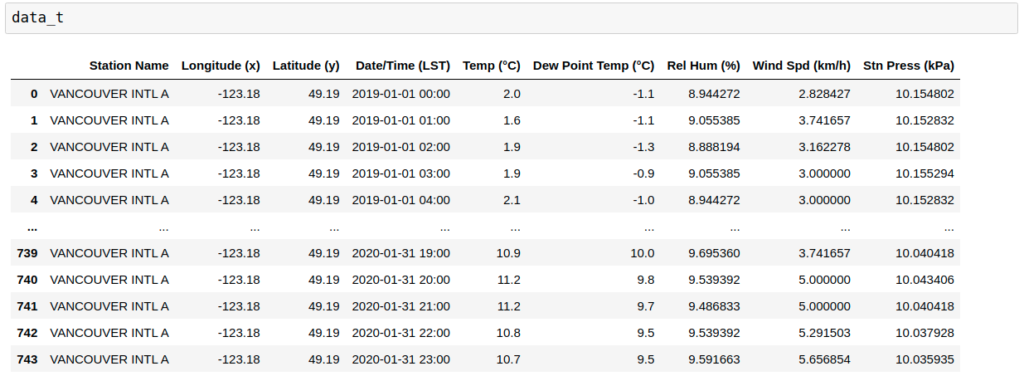
Apply power or exponential transformations to numerical variables.
# set up the variable transformer
tf = vt.PowerTransformer(variables = ['Stn Press (kPa)', 'Rel Hum (%)','Wind Spd (km/h)'], exp=0.5)

# fit the transformer
tf.fit(data)
data_t= tf.transform(data)
applies the BoxCox transformation to numerical variables by
y = (x**lmbda - 1) / lmbda,  for lmbda != 0
log(x),                      for lmbda = 0
With fit(), learns the optimal lambda for the transformation. Only apply to positive variables.
# set up the variable transformer
tf = vt.BoxCoxTransformer(variables = ['Stn Press (kPa)', 'Rel Hum (%)'])

# fit the transformer
tf.fit(data)
data_t= tf.transform(data)

learns the optimal lambda for the transformation.
# set up the variable transformer
tf = vt.YeoJohnsonTransformer(variables = ['Temp (°C)','Dew Point Temp (°C)'])

# fit the transformer
tf.fit(data)
data_t= tf.transform(data)
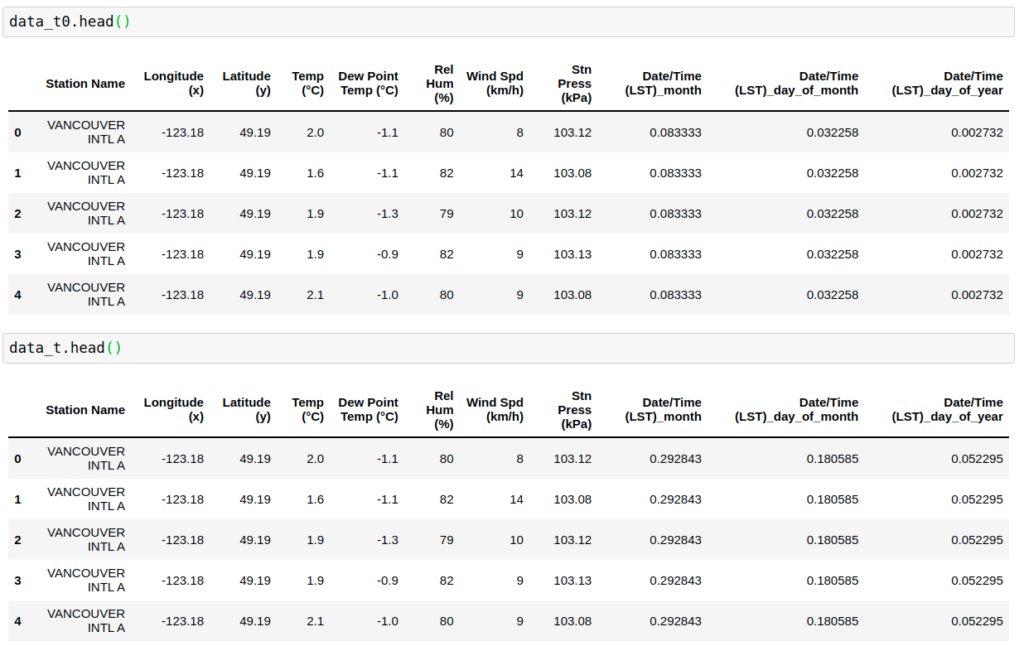
Apply the arcsin transformation to numerical variables.take the form of arcsin(sqrt(x)) where x is a real number between 0 and 1.
step 1: use DatetimeFeatures to extract “month”, “day_of_month”, “day_of_year”
step 2: divide them by 12, 31, and 366 to convert them to 0-1 range
step 3:apply arcsin(sqrt(x))
from feature_engine.datetime import DatetimeFeatures
dtfs = DatetimeFeatures(
    variables="Date/Time (LST)",
    features_to_extract=["month", "day_of_month", "day_of_year"]
)

data_t0 = dtfs.fit_transform(data)
data_t0['Date/Time (LST)_month']=data_t0['Date/Time (LST)_month']/12
data_t0['Date/Time (LST)_day_of_month']=data_t0['Date/Time (LST)_day_of_month']/31
data_t0['Date/Time (LST)_day_of_year']=data_t0['Date/Time (LST)_day_of_year']/366

# set up the variable transformer
tf = vt.ArcsinTransformer(variables = ['Date/Time (LST)_month','Date/Time (LST)_day_of_month','Date/Time (LST)_day_of_year'])
tf.fit(data_t0)

# fit the transformer
tf.fit(data_t0)
data_t= tf.transform(data_t0)