If you have grid or point data and polygon shapefiles for longitude and longitude. Using geopandas and shapely it’s easy to find grids or points in specific polygons.
import geopandas as gpd
import pandas as pd
import numpy as np
import matplotlib.pyplot as plt
from shapely.geometry import Point
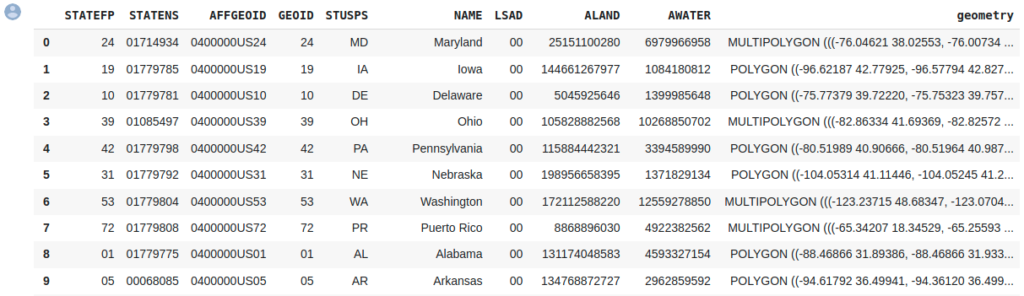
# US state polygon shape file
US_states=gpd.GeoDataFrame.from_file('states_province_shapefile\cb_2018_us_state_20m\cb_2018_us_state_20m.shp')
US_states
X=np.load('rainfed_maize_production_Xgrid.npy') #Longitudes of 2-dimension grid points
Y=np.load('rainfed_maize_production_Ygrid.npy') #Latitudes of 2-dimension grid points
xx=X.flatten()
yy=Y.flatten()
#
df = pd.DataFrame({'lon':xx, 'lat':yy})
df['coords'] = list(zip(df['lon'],df['lat']))
df['coords'] = df['coords'].apply(Point)
points=gpd.GeoDataFrame(df, geometry='coords', crs=US_states.crs)
#
pointInPolys = gpd.tools.sjoin(points, US_states, predicate="within", how='left')
#
pnt_Iowa = points[pointInPolys.NAME=='Iowa']
pnt_MN = points[pointInPolys.STUSPS=='MN']
pnt_IA = points[pointInPolys.STUSPS=='IA']
pnt_WI = points[pointInPolys.STUSPS=='WI']
pnt_IL = points[pointInPolys.STUSPS=='IL']
pnt_MI = points[pointInPolys.STUSPS=='MI']
pnt_IN = points[pointInPolys.STUSPS=='IN']
pnt_OH = points[pointInPolys.STUSPS=='OH']
pnt_NY = points[pointInPolys.STUSPS=='NY']
pnt_PA = points[pointInPolys.STUSPS=='PA']
pnt_MD = points[pointInPolys.STUSPS=='MD']
#
pnt_IA.to_csv('state_province_gridcell_csvfiles\Gridcell_IA.csv')
pnt_MN.to_csv('state_province_gridcell_csvfiles\Gridcell_MN.csv')
pnt_WI.to_csv('state_province_gridcell_csvfiles\Gridcell_WI.csv')
pnt_IL.to_csv('state_province_gridcell_csvfiles\Gridcell_IL.csv')
pnt_MI.to_csv('state_province_gridcell_csvfiles\Gridcell_MI.csv')
pnt_IN.to_csv('state_province_gridcell_csvfiles\Gridcell_IN.csv')
pnt_OH.to_csv('state_province_gridcell_csvfiles\Gridcell_OH.csv')
pnt_NY.to_csv('state_province_gridcell_csvfiles\Gridcell_NY.csv')
pnt_PA.to_csv('state_province_gridcell_csvfiles\Gridcell_PA.csv')
pnt_MD.to_csv('state_province_gridcell_csvfiles\Gridcell_MD.csv')
#
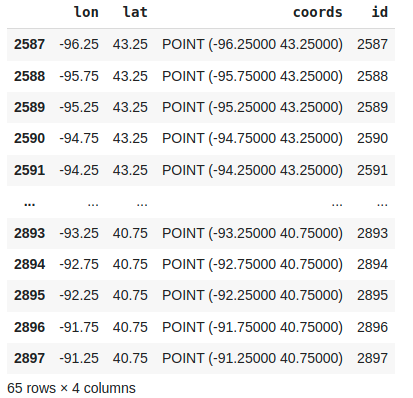
pnt_Iowa
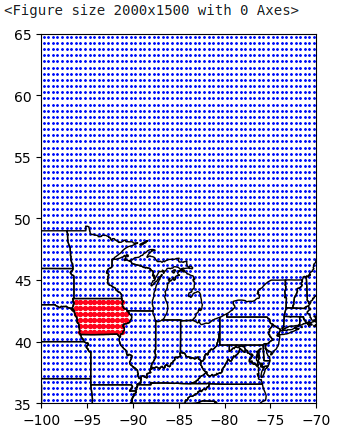
figure=plt.figure(figsize=(20,15))
base = US_states.boundary.plot(linewidth=1, edgecolor="black")
points.plot(ax=base, linewidth=1, color="blue", markersize=1)
pnt_Iowa.plot(ax=base, linewidth=1, color="red", markersize=8)
plt.xlim([-100,-70])
plt.ylim([35,65])
plt.show()
#Canada
## https://www12.statcan.gc.ca/census-recensement/2011/geo/bound-limit/files-fichiers/gpr_000b11a_e.zip
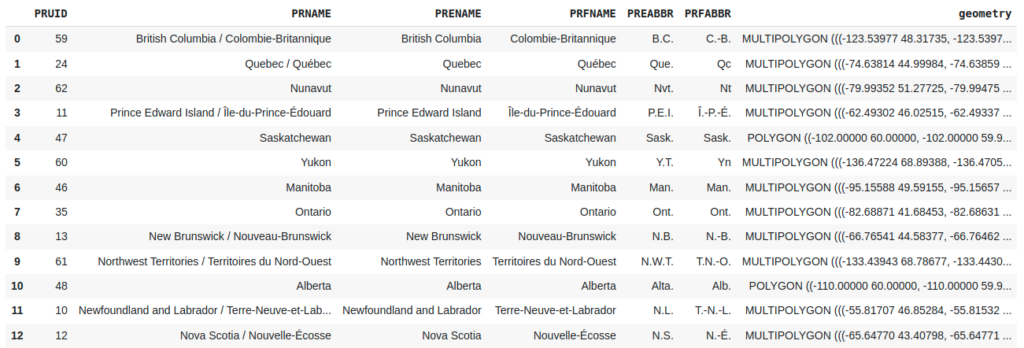
CA_provinces=gpd.GeoDataFrame.from_file('states_province_shapefile\gpr_000b11a_e\gpr_000b11a_e.shp')
ca_points=gpd.GeoDataFrame(df, geometry='coords', crs=CA_provinces.crs)
Ca_pointInPolys = gpd.tools.sjoin(ca_points, CA_provinces, predicate="within", how='left')
CA_provinces
pnt_Ontario = ca_points[Ca_pointInPolys.PRENAME=='Ontario']
pnt_Quebec = ca_points[Ca_pointInPolys.PRENAME=='Quebec']
pnt_Quebec.to_csv('state_province_gridcell_csvfiles\Gridcell_QC.csv')
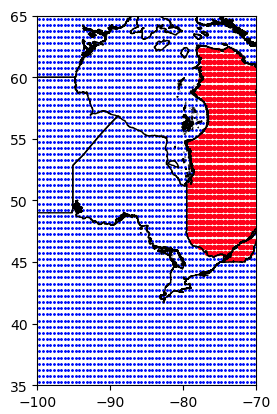
# Plot map with points in Quebec in red
#figure=plt.figure(figsize=(20,15))
base =CA_provinces.boundary.plot(linewidth=1, edgecolor="black")
points.plot(ax=base, linewidth=1, color="blue", markersize=1)
pnt_Quebec.plot(ax=base, linewidth=1, color="red", markersize=8)
plt.xlim([-100,-70])
plt.ylim([35,65])
plt.show()
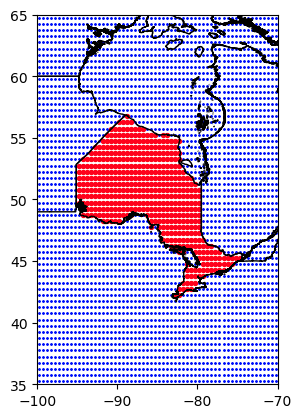
# Plot map with points in Ontario in red
#figure=plt.figure(figsize=(20,15))
base =CA_provinces.boundary.plot(linewidth=1, edgecolor="black")
points.plot(ax=base, linewidth=1, color="blue", markersize=1)
pnt_Ontario.plot(ax=base, linewidth=1, color="red", markersize=8)
plt.xlim([-100,-70])
plt.ylim([35,65])
plt.show()