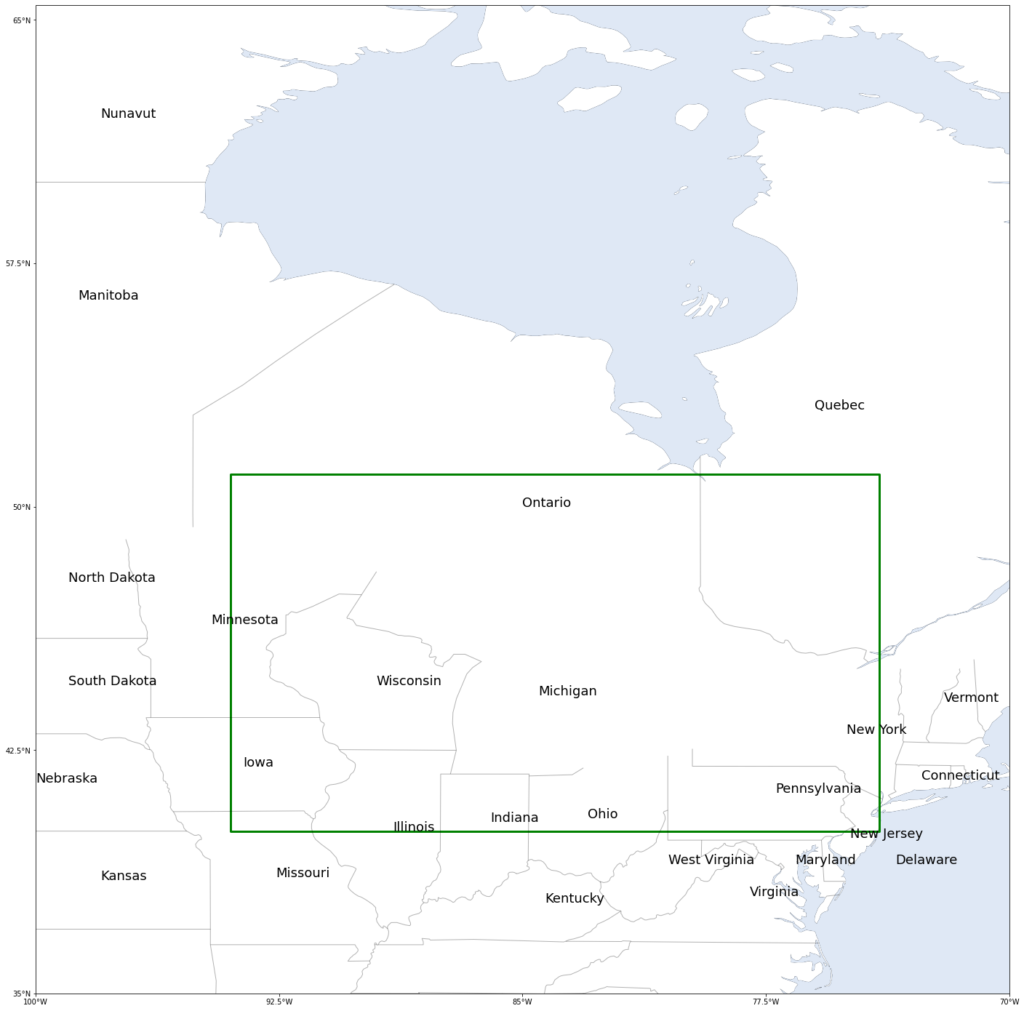
The following python program show you the method to draw a rectangular area in a map and mark state or province name on the map.
Answer to other questions:
- How to add ocean, lake, river, coastline, province border to map?
- How to set map extent?
- How to set xtick or ytick intervals?
# Ignore warnings
import sys
import warnings
if not sys.warnoptions:
warnings.simplefilter('ignore')
#Process data
import numpy as np
#Display data
import cartopy
import cartopy.crs as ccrs
from cartopy.mpl.geoaxes import GeoAxes
from cartopy.vector_transform import vector_scalar_to_grid
from matplotlib.axes import Axes
import cartopy.feature as cfeature
from cartopy import config
from cartopy.mpl.ticker import LongitudeFormatter, LatitudeFormatter
from mpl_toolkits.axes_grid1 import AxesGrid
import matplotlib.pyplot as plt
import matplotlib.patches as mpatches
from shapely.geometry.polygon import LinearRing
%matplotlib inline
#-------------------------------------------------------------
provinces= ['Ontario', 'Quebec','Manitoba','Wisconsin','Vermont','Nebraska','New York','Kansas','Illinois',
'Delaware','Connecticut','Indiana','Missouri','Michigan','New Jersey','Kentucky','Minnesota',
'Ohio','Iowa','Pennsylvania','Maryland','Virginia','West Virginia','North Dakota','South Dakota','Nunavut']
Latitudes= [50,53,56.4,44.5,44,41.5,43,38.5,40,39,41.6,40.3,38.6,44.2,39.8,37.8,46.4,
40.4,42,41.2,39,38,39,47.7,44.5,62]
Longitudes=[-85,-76,-98.7,-89.5,-72,-100,-75,-98,-89,-73.5,-72.7,-86,-92.6,-84.5,-74.9,-84.3,-94.6,
-83,-93.6,-77.2,-76.6,-78,-80.5,-99,-99,-98]
#-------------------------------------------------------------
fig = plt.figure(figsize=(25,25))
projection = ccrs.PlateCarree()
provinc_bodr = cartopy.feature.NaturalEarthFeature(category='cultural',
name='admin_1_states_provinces_lines', scale='50m', facecolor='none', edgecolor='k')
axes_class = (GeoAxes,
dict(map_projection=projection))
axgr = AxesGrid(fig, 111, axes_class=axes_class,
nrows_ncols=(1, 1),
axes_pad=0.6,
label_mode='') # note the empty label_mode
for i, ax in enumerate(axgr):
ax.add_feature(cfeature.OCEAN, alpha=0.3)
ax.add_feature(cfeature.COASTLINE,linewidth=0.3)
ax.add_feature(cfeature.BORDERS, linestyle='-', alpha=1)
ax.add_feature(cfeature.LAKES, alpha=1)
ax.add_feature(cfeature.RIVERS)
ax.add_feature(cfeature.NaturalEarthFeature('physical', 'land', '50m', \
edgecolor='none', facecolor="white"), zorder=1)
ax.add_feature(provinc_bodr, linestyle='-', linewidth=1, edgecolor="k", zorder=10, alpha=0.3)
ax.set_xticks(np.linspace(-100, -70, 5), crs=projection)
ax.set_yticks(np.linspace(35, 65, 5), crs=projection)
lon_formatter = LongitudeFormatter(zero_direction_label=True)
lat_formatter = LatitudeFormatter()
ax.xaxis.set_major_formatter(lon_formatter)
ax.yaxis.set_major_formatter(lat_formatter)
ax.set_extent([-100, -70, 35, 65])
# mark the state name
for iprov in range(26):
ax.text(Longitudes[iprov],Latitudes[iprov],provinces[iprov],fontsize=18)
# plot the rectangular region
#-----------------------------------------------------------------
lons = [-94, -74, -74, -94]
lats = [40, 40,51,51]
ring = LinearRing(list(zip(lons, lats)))
ax.add_geometries([ring], ccrs.PlateCarree(), facecolor='none', edgecolor='green',linewidth=3)
#------------------------------------------------------------------
plt.show()
The result is shown as blow: