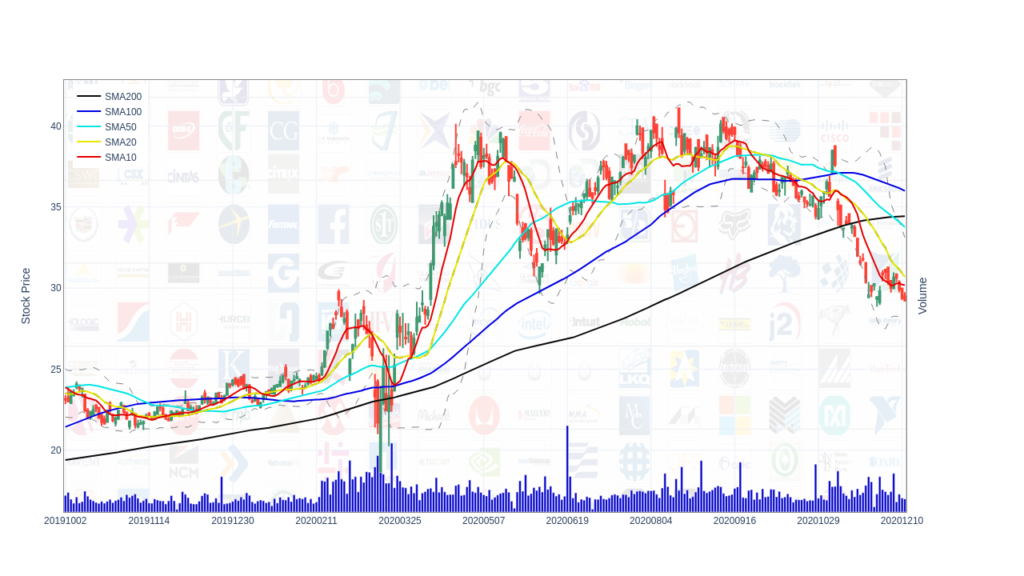
Following is my python code to plot stock chart on a background image from local file. The code is not optimal, I will improve it later. Hope it be useful. The example is plot ABX.TO.csv (download from yahoo finance) data on a logo collection image (my file:/media/Data1/XIU/AACodes/NASDAQ_stocks.png).
Code
# plot stock data with a background-image

import numpy as np
import talib
import emoji
import pandas as pd
from datetime import datetime,date

from ta import add_all_ta_features
from ta.utils import dropna
from ta.trend import sma_indicator

import plotly.graph_objects as go

import chart_studio.plotly as py
from plotly.subplots import make_subplots
import math

candleRank=pd.read_csv('CandleStick_rankings.csv')
candle_names = talib.get_function_groups()['Pattern Recognition']
candleRank=candleRank.set_index('Unnamed: 0')
from PIL import Image

img = Image.open('/media/Data1/XIU/AACodes/NASDAQ_stocks.png') #my background image
Ndays=302

thefile='/media/Data1/XIU/AData4OneYear/TSX/ABX.TO.csv'
fn=thefile

df0=pd.read_csv(fn)
df0['Date']=df0['Date'].astype('datetime64[ns]')
df0=df0.rename(columns={'Date':'date'})
df0 = dropna(df0)

df0 = add_all_ta_features(df0, open="Open", high="High", low="Low", close="Close", volume="Volume")
df0['SMA200']=sma_indicator(df0['Close'],n=200)
df0['SMA100']=sma_indicator(df0['Close'],n=100)
df0['SMA50']=sma_indicator(df0['Close'],n=50)
df0['SMA20']=sma_indicator(df0['Close'],n=20)
df0['SMA10']=sma_indicator(df0['Close'],n=10)
df=df0.iloc[-Ndays:]
df=df.reset_index()

#image stretch parameters

YH=math.ceil(max([max(df.High),max(df.SMA200),max(df.SMA100),max(df.SMA50),max(df.SMA10),max(df.volatility_bbh)]))+2
YL=math.floor(min([min(df.Low),min(df.SMA200),min(df.SMA100),min(df.SMA50),min(df.SMA10),min(df.volatility_bbl)]))-5
LH=YH-YL

tickvals = list(range(0, Ndays, 30))
tickstxt0=df.date.dt.year*10000+df.date.dt.month*100+df.date.dt.day
tickstxt1=tickstxt0[tickvals]
ticktxt=tickstxt1.astype(str)
#ticktxt

# following section is plot the stock chart on a background image
fig = make_subplots(
        rows=1, cols=1,
        specs=[[{"rowspan":1,"secondary_y": True}]])

fig.add_trace(go.Candlestick(x=df.index,
                         open=df['Open'],
                         high=df['High'],
                         low=df['Low'],
                         close=df['Close'], showlegend=False,
                        ))
fig.add_trace(go.Scatter(x=df.index,
                              y=df.volatility_bbm,
                              mode='lines',
                              name="BBM",showlegend=False,
                              line=dict(color='rgb(30,30,30)', width=2, dash='dash')))
fig.add_trace(go.Scatter(x=df.index,
                              y=df.volatility_bbh,
                              mode='lines', name="BBH",showlegend=False,
                              line=dict(color='rgb(130,130,130)', width=1, dash='dash')))
fig.add_trace(go.Scatter(x=df.index,
                              y=df.volatility_bbl,
                              mode='lines',
                              name="BBL",showlegend=False,
                              line=dict(color='rgb(130,130,130)', width=1, dash='dash')))


fig.add_layout_image(
        dict(
            source=img,
            xref="x",
            yref="y",
            x=0,
            y=YH,
            sizex=Ndays,
            sizey=LH,
            sizing="stretch",
            opacity=0.1,
            layer="below")
)
fig.add_trace(go.Bar(x=df.index,
               y=df.Volume,
               base=0,
               name="Volume",showlegend=False,
               marker_color='rgb(0, 0, 201)'),secondary_y=True)

fig.add_trace(go.Scatter(x=df.index,
                              y=df.SMA200,
                              name="SMA200",showlegend=True,
                              line=dict(color='rgb(10, 10, 10)',
                              width=2)),secondary_y=False)
fig.add_trace(go.Scatter(x=df.index,
                              y=df.SMA100,
                              name="SMA100",showlegend=True,
                              line=dict(color='rgb(0, 0, 230)',
                              width=2)),secondary_y=False)
fig.add_trace(go.Scatter(x=df.index,
                              y=df.SMA50,
                              name="SMA50",showlegend=True,
                              line=dict(color='rgb(0, 230, 230)',
                              width=2)),secondary_y=False)
fig.add_trace(go.Scatter(x=df.index,
                              y=df.SMA20,
                              name="SMA20",showlegend=True,
                              line=dict(color='rgb(230, 230, 0)',
                              width=2)),secondary_y=False)
fig.add_trace(go.Scatter(x=df.index,
                              y=df.SMA10,
                              name="SMA10",showlegend=True,
                              line=dict(color='rgb(230, 0, 0)',
                              width=2)),secondary_y=False)


fig.update_yaxes(title_text="Stock Price",showline=True,linecolor='#888888',
                     mirror=True,showgrid=True,zeroline=False)
fig.update_xaxes(showline=True,linecolor='#888888',
                     mirror=True,showgrid=True,zeroline=False)
fig.update_yaxes(secondary_y=True,title_text="Volume",showline=True,linecolor='#888888', mirror=True,
                     showgrid=True, gridwidth=1, gridcolor='#eeeeee',
                     range=[0, df.Volume.max()*5],showticklabels=False)

# Set templates
fig.update_layout(height=720,width=1280,
                  template="plotly_white",
                  xaxis = dict(
                        tickmode = 'array',
                        tickvals = tickvals,
                        ticktext = ticktxt
                        ),
                 xaxis1 = {"rangeslider": {"visible": False}},
                 legend=dict(
                            yanchor="top",
                            y=0.99,
                            xanchor="left",
                            x=0.01
))

fig.show()
fig.write_image('test.png')
Result
