Table of Contents
Market Summary
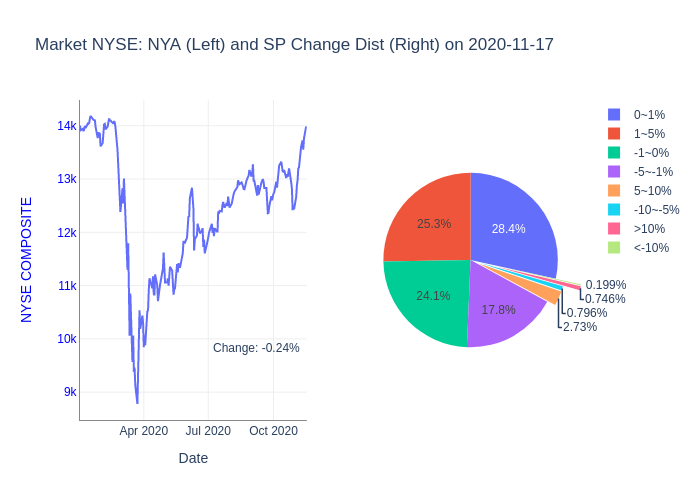
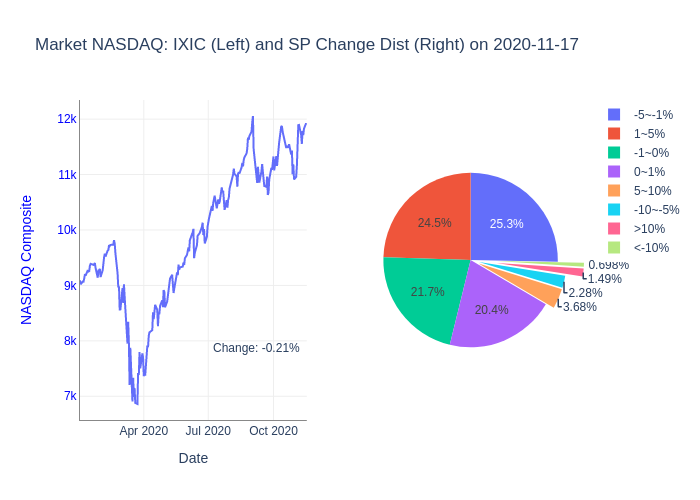
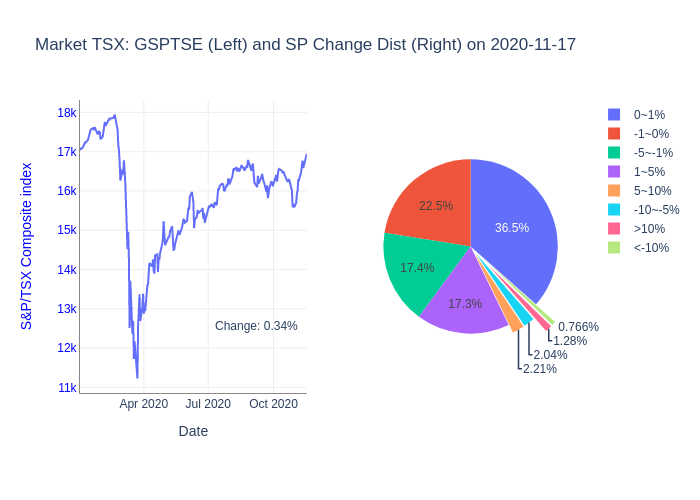
- NYSE and NASDAQ composite indexes fell and TSX composite index rose
- 55% of the stocks on NYSE market rose and 43% of the stocks fell
- 48% of the stocks on NASDAQ market rose and 50% of the stocks fell
- 49% of the stocks on TSX market rose and 43% of the stocks fell
NYSE Summary
Based on data of 2011 stocks traded on NYSE
- 55.1% stocks rose,42.8% stocks fell
- 3.5% stocks jumped more than 5%,1.0% stocks dropped more than 5%
- 52.5% stocks swang between -1% and 1%
NYSE top 10 stocks:
Top Moneyflow:💸:
Most active:🔥:
Top gainers:🚀:
Golden Crosses:🇯🇪 :
😷🧼🏡😷🧼🏡😷🧼🏡😷🧼🏡
NASDAQ Summary
Based on data of 2149 stocks traded on NASDAQ
- 47.8% stocks rose,50.0% stocks fell
- 5.1% stocks jumped more than 5%,3.0% stocks dropped more than 5%
- 42.1% stocks swang between -1% and 1%
NASDAQ top 10 stocks:
Top Moneyflow:💸:
Most active:🔥:
Top gainers:🚀:
Golden Crosses:🇯🇪 :
😷🧼🏡😷🧼🏡😷🧼🏡😷🧼🏡
TSX Summary
Based on data of 1175 stocks traded on TSX
- 49.4% stocks rose,42.7% stocks fell
- 3.4% stocks jumped more than 5%,2.8% stocks dropped more than 5%
- 59.0% stocks swang between -1% and 1%
TSX top 10 stocks:
Top Moneyflow:💸:
Most active:🔥:
Top gainers:🚀:
HUT.TO 17%
MOGO.TO 17%
CWEB.TO 10%
MAXR.TO 10%
SES.TO 8%
BTE.TO 7%
KEL.TO 6%
LSPD.TO 5%
APHA.TO 4%
ERO.TO 4%
Golden Crosses:🇯🇪 :
😷🧼🏡😷🧼🏡😷🧼🏡😷🧼🏡
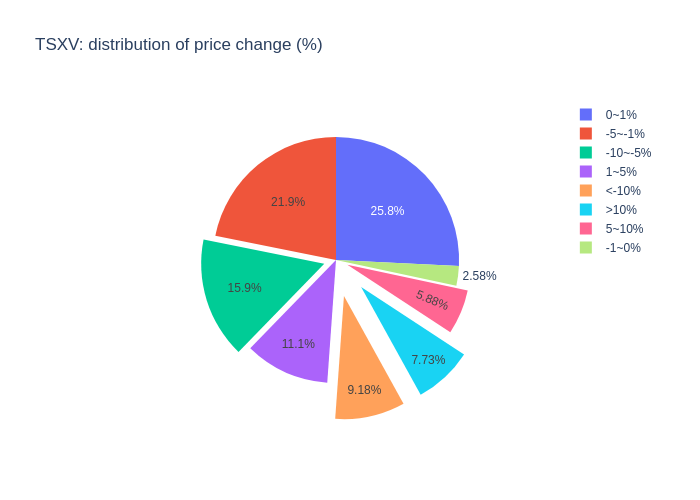
TSXV Summary
Based on data of 970 stocks traded on TSXV
- 25.5% stocks rose,49.5% stocks fell
- 13.3% stocks jumped more than 5%,25.1% stocks dropped more than 5%
- 28.4% stocks swang between -1% and 1%
TSXV top 10 stocks:
Top Moneyflow:💸:
Most active:🔥:
Top gainers:🚀:
IFR.V 50%
BUS.V 35%
GPM.V 33%
FA.V 25%
GAL.V 22%
HIVE.V 19%
GTEC.V 17%
FMS.V 17%
IMR.V 17%
FNR.V 15%
Golden Crosses:🇯🇪 :
😷🧼🏡😷🧼🏡😷🧼🏡😷🧼🏡
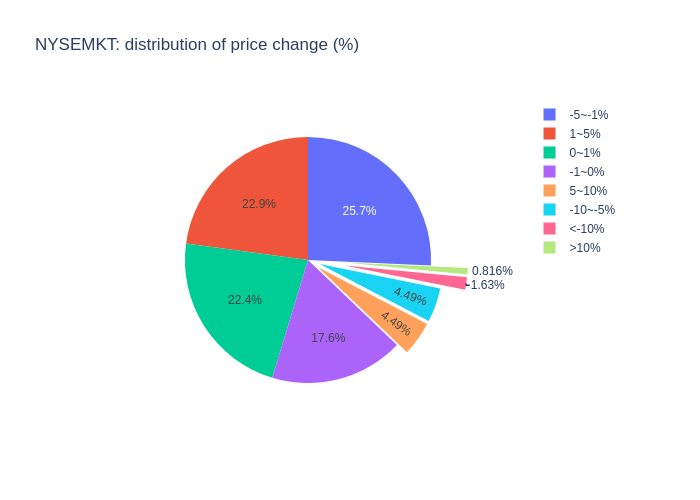
NYSEMKT Summary
Based on data of 245 stocks traded on NYSEMKT
- 44.1% stocks rose,49.4% stocks fell
- 5.3% stocks jumped more than 5%,6.1% stocks dropped more than 5%
- 40.0% stocks swang between -1% and 1%
NYSEMKT top 10 stocks:
Top Moneyflow:💸:
Most active:🔥:
Top gainers:🚀:
