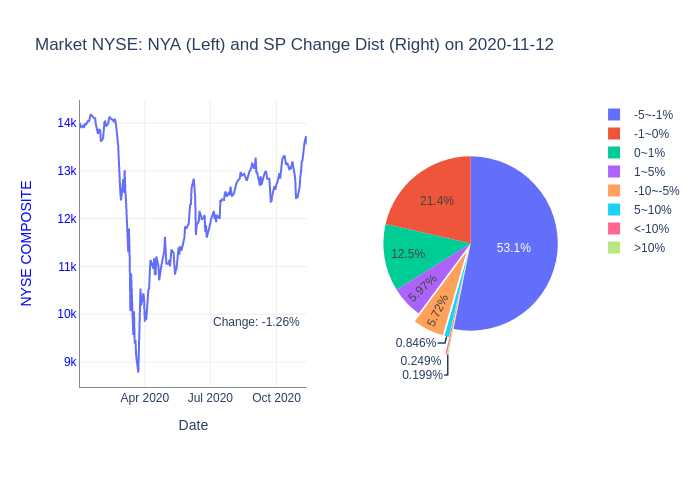
Following the decline in Asian and European stock markets, the US and Canadian stock markets fell. Today, 81%, 71% and 63% of stocks on the New York Stock Exchange, Nasdaq and Toronto Stock Exchange markets have fallen, respectively.
Table of Contents
NYSE Summary
Based on data of 2010 stocks traded on NYSE
- 17.7% stocks rose,80.5% stocks fell
- 1.0% stocks jumped more than 5%,6.0% stocks dropped more than 5%
- 33.9% stocks swang between -1% and 1%
NYSE top 10 stocks:
Top Moneyflow:💸:
Most active:🔥:
Top gainers:🚀:
😷🧼🏡😷🧼🏡😷🧼🏡😷🧼🏡
NASDAQ Summary
Based on data of 2140 stocks traded on NASDAQ
- 27.0% stocks rose,71.0% stocks fell
- 4.6% stocks jumped more than 5%,7.7% stocks dropped more than 5%
- 29.7% stocks swang between -1% and 1%
NASDAQ top 10 stocks:
Top Moneyflow:💸:
Most active:🔥:
Top gainers:🚀:
😷🧼🏡😷🧼🏡😷🧼🏡😷🧼🏡
TSX Summary
Based on data of 1147 stocks traded on TSX
- 30.4% stocks rose,62.7% stocks fell
- 3.2% stocks jumped more than 5%,8.2% stocks dropped more than 5%
- 44.7% stocks swang between -1% and 1%
TSX top 10 stocks:
Top Moneyflow:💸:
Most active:🔥:
Top gainers:🚀:
ITP.TO 21%
HED.TO 11%
SSRM.TO 10%
AT.TO 8%
SOY.TO 8%
TGZ.TO 7%
LUG.TO 6%
HND.TO 5%
K.TO 4%
SIL.TO 4%
😷🧼🏡😷🧼🏡😷🧼🏡😷🧼🏡
TSXV Summary
Based on data of 935 stocks traded on TSXV
- 32.1% stocks rose,41.4% stocks fell
- 16.0% stocks jumped more than 5%,20.7% stocks dropped more than 5%
- 29.6% stocks swang between -1% and 1%
TSXV top 10 stocks:
Top Moneyflow:💸:
Most active:🔥:
Top gainers:🚀:
LBI.V 62%
ETMC.V 43%
GEM.V 38%
FNC.V 28%
JTR.V 22%
GXL.V 19%
FTI.V 19%
EMO.V 19%
FMS.V 17%
LBL.V 17%
😷🧼🏡😷🧼🏡😷🧼🏡😷🧼🏡
NYSEMKT Summary
Based on data of 247 stocks traded on NYSEMKT
- 36.4% stocks rose,60.3% stocks fell
- 6.5% stocks jumped more than 5%,10.9% stocks dropped more than 5%
- 33.2% stocks swang between -1% and 1%


