Table of Contents
Introduction
Climate change affects all aspects of society. Before we understand how it affects our lives, we should know how much it has changed and how much it will change in the near future.
Climate Normal (1991-2020)
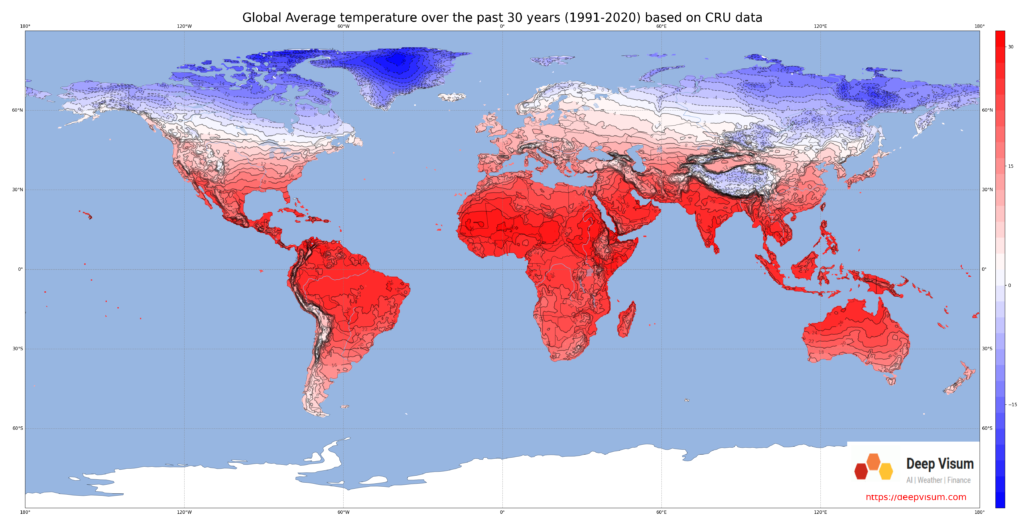
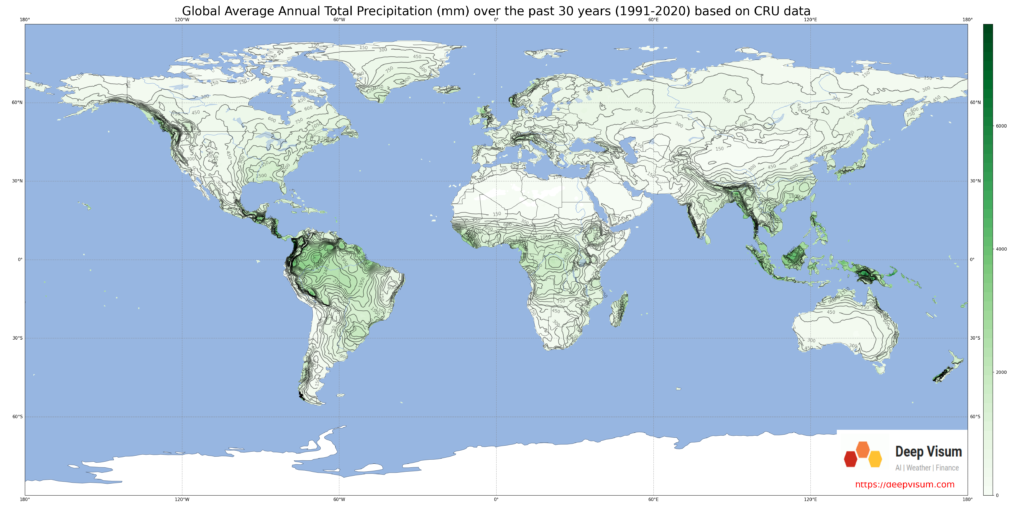
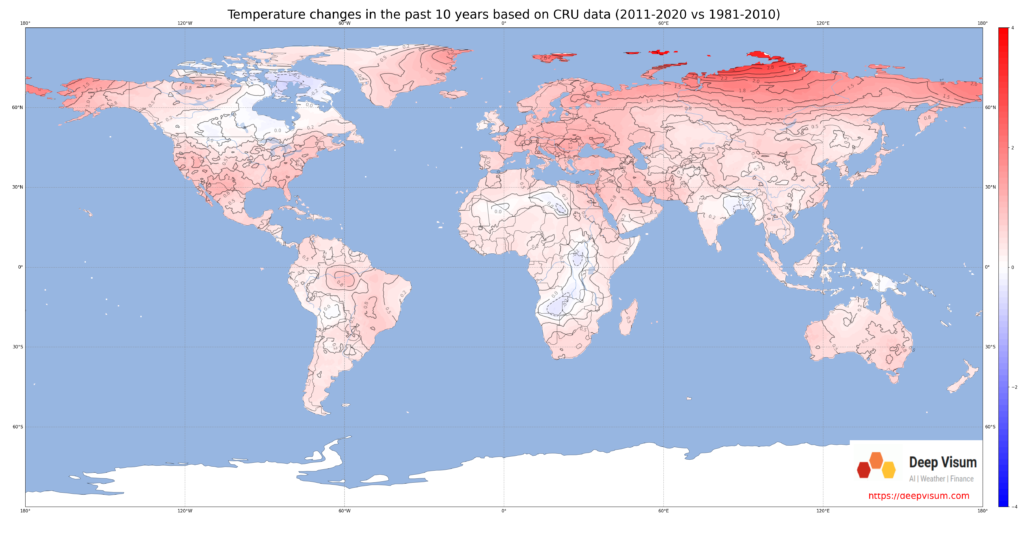
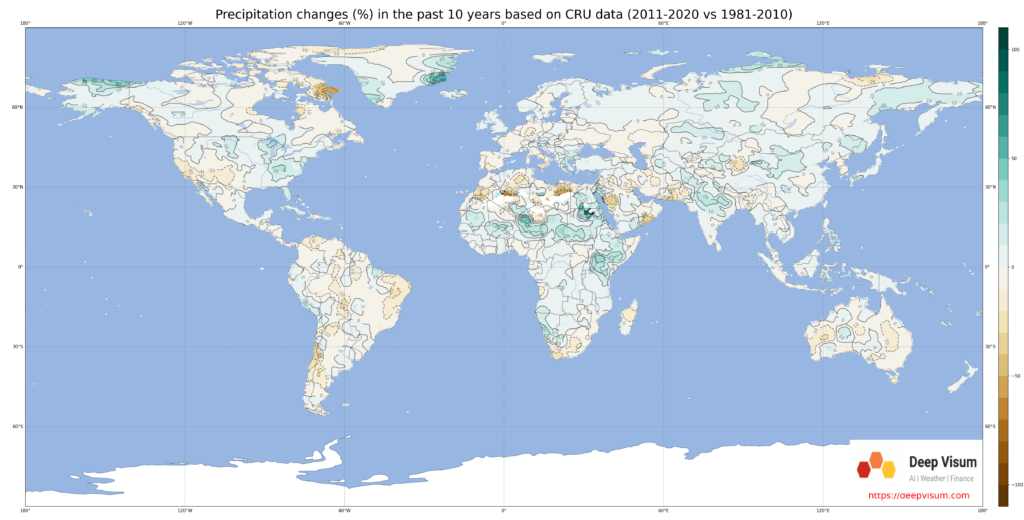
Change in the past 10 years (2011-2020 vs 1981-2010)🔝
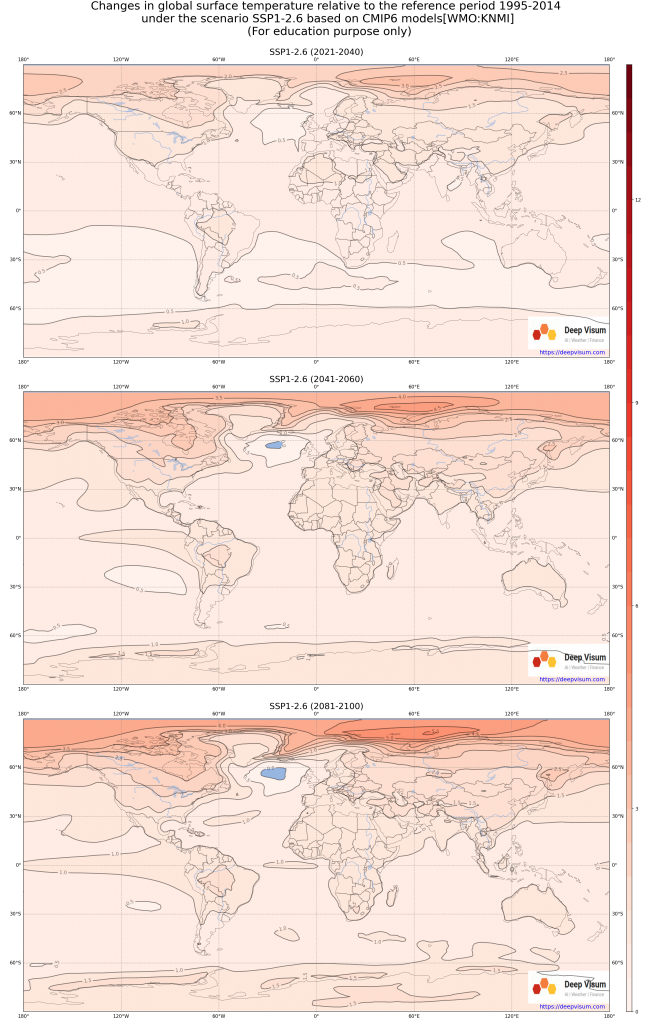
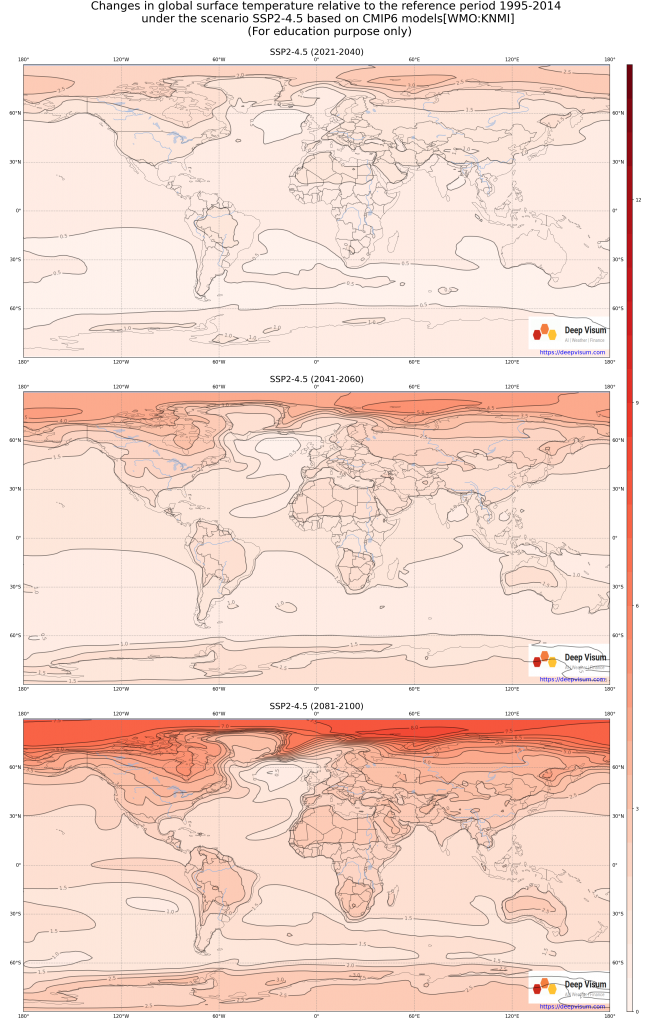
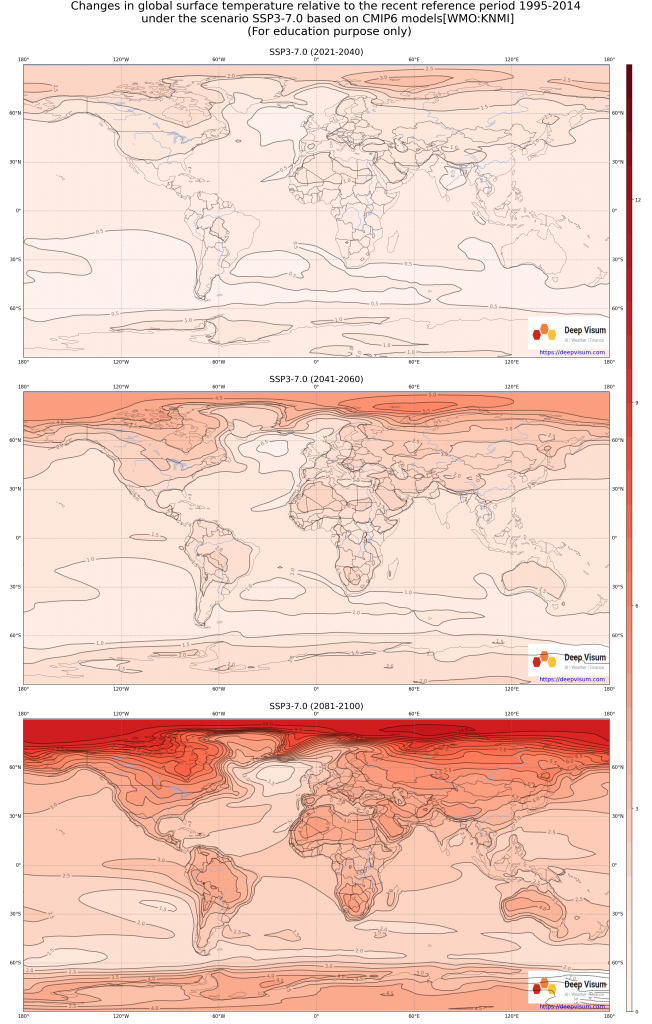
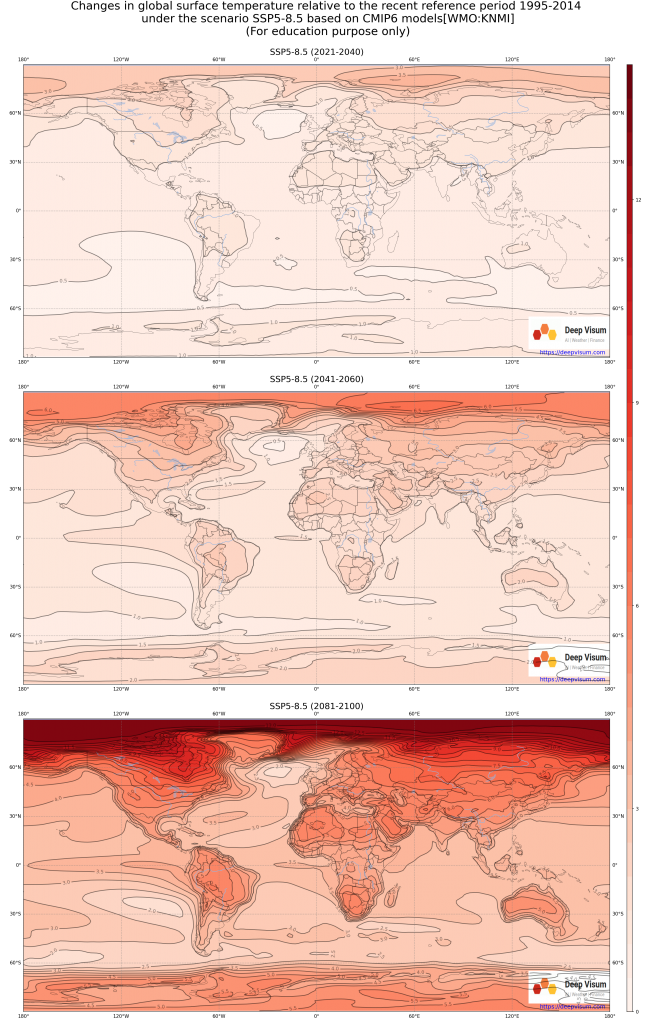
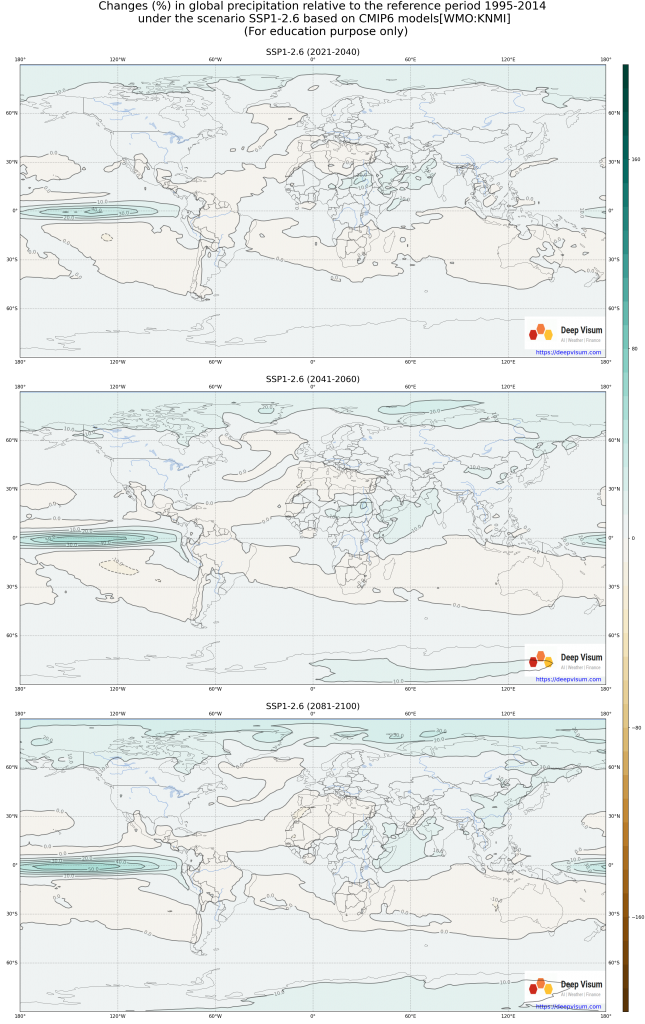
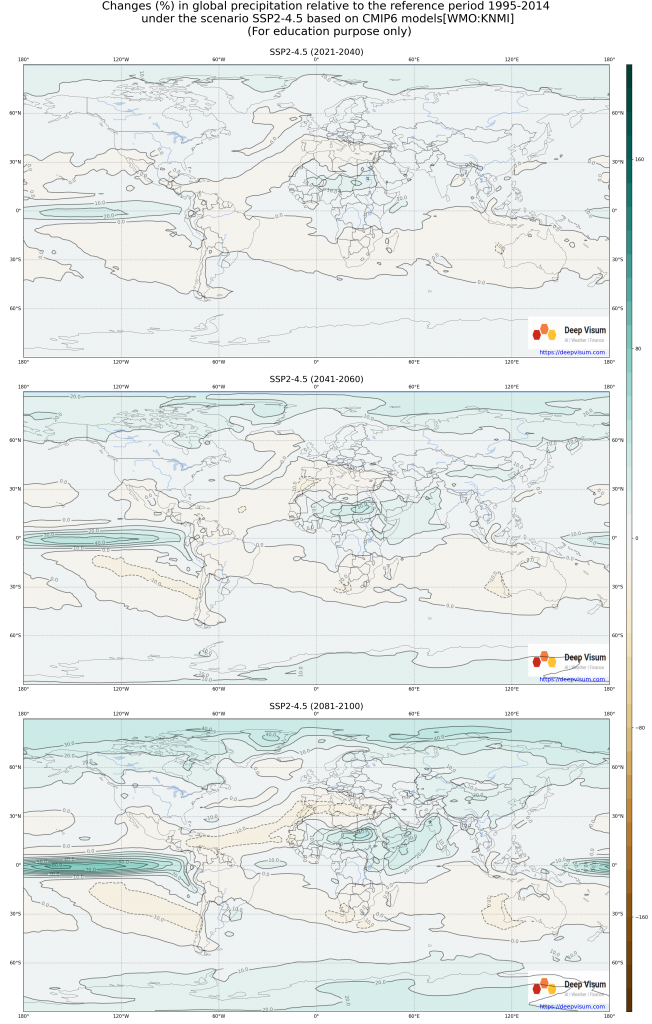
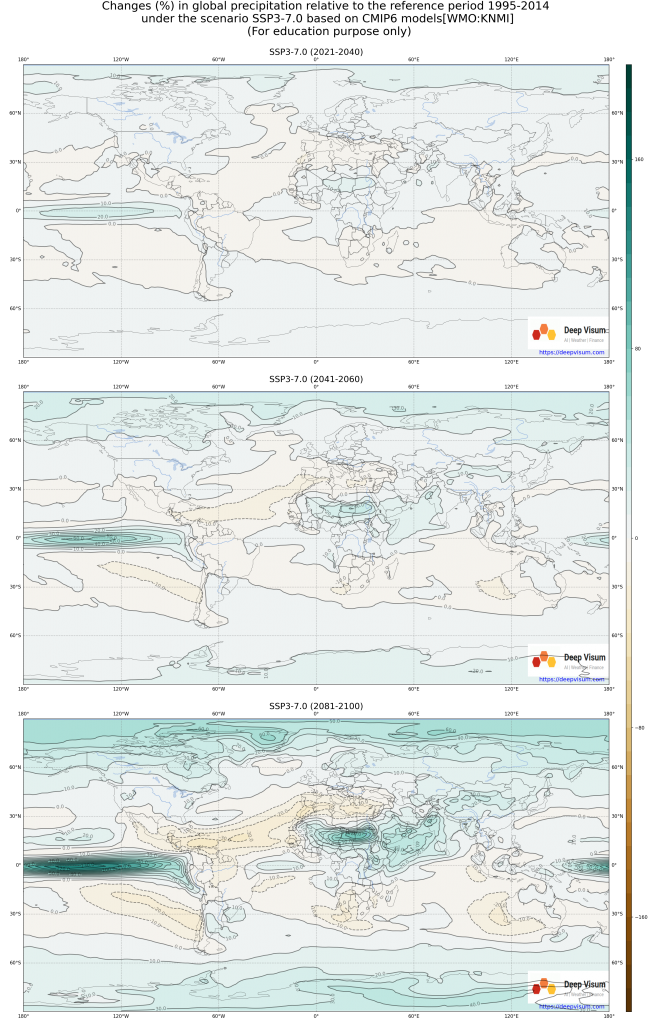
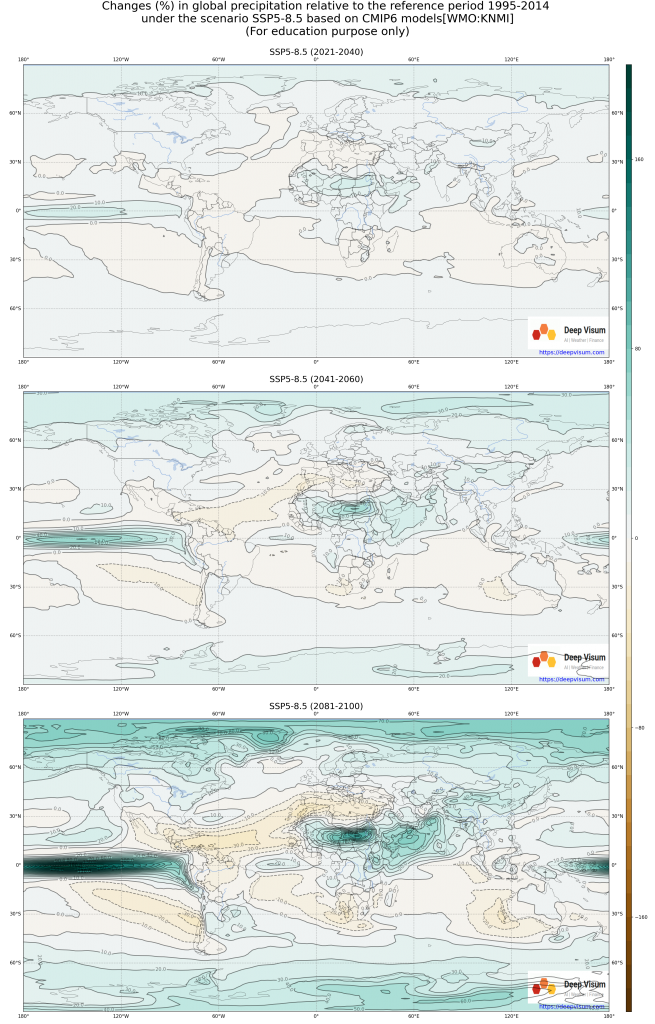
Change in the future (2021-2100) under different Shared Socioeconomic Pathways (SSPs)
Average Annual Temperature🔝
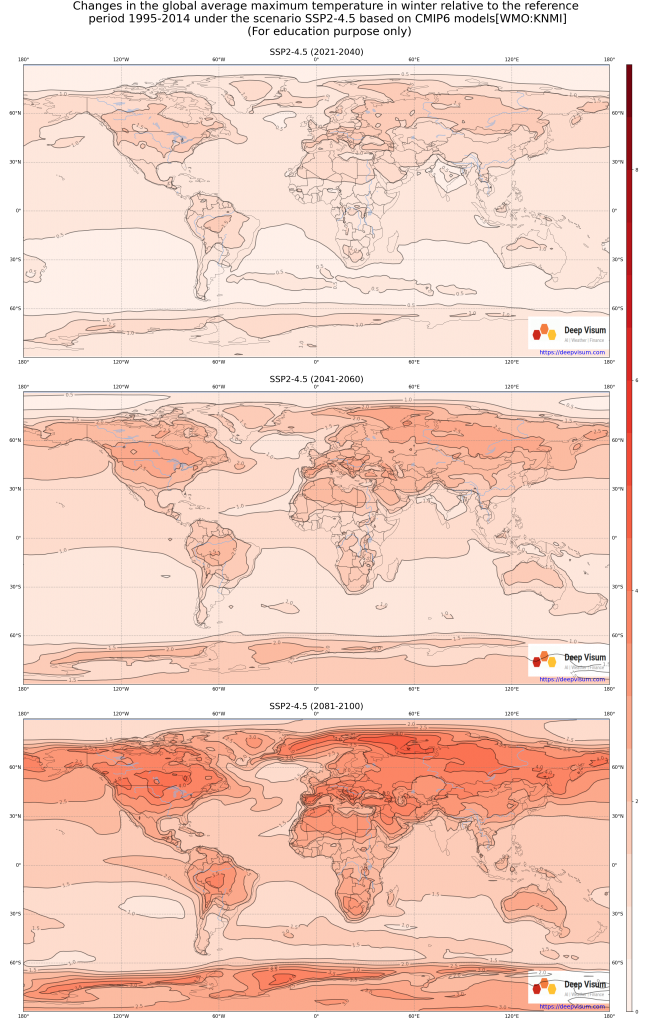
Averaged Winter Daily Minimum Temperature🔝
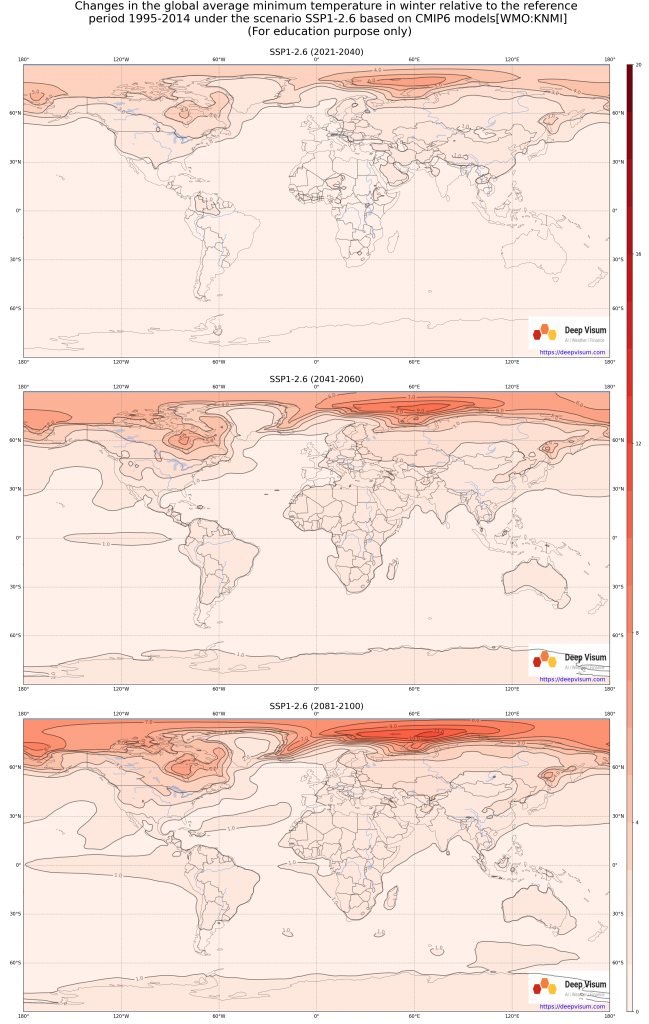
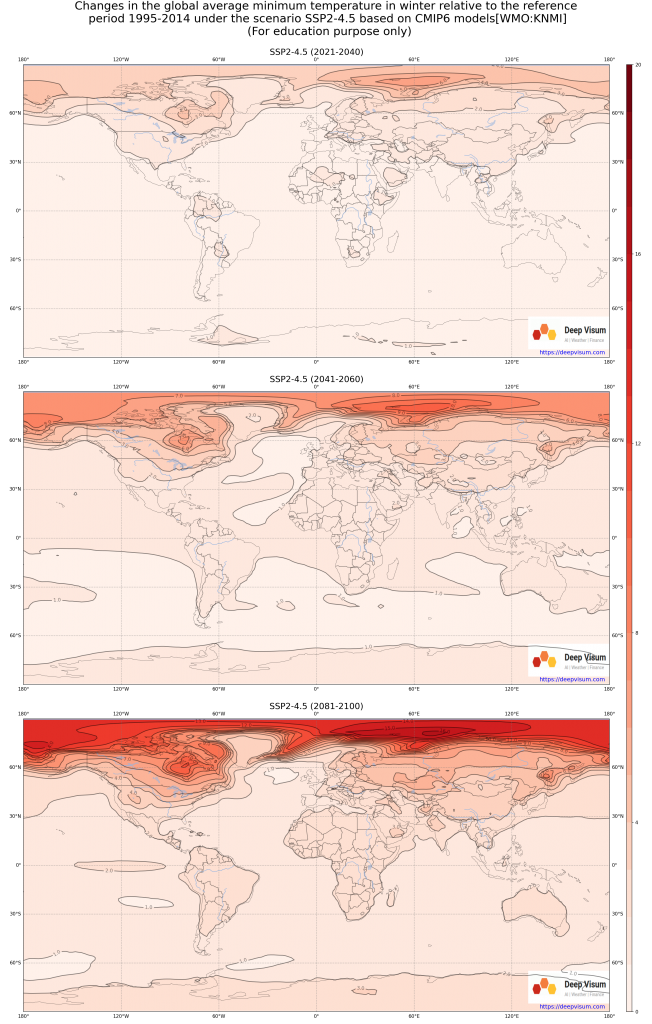
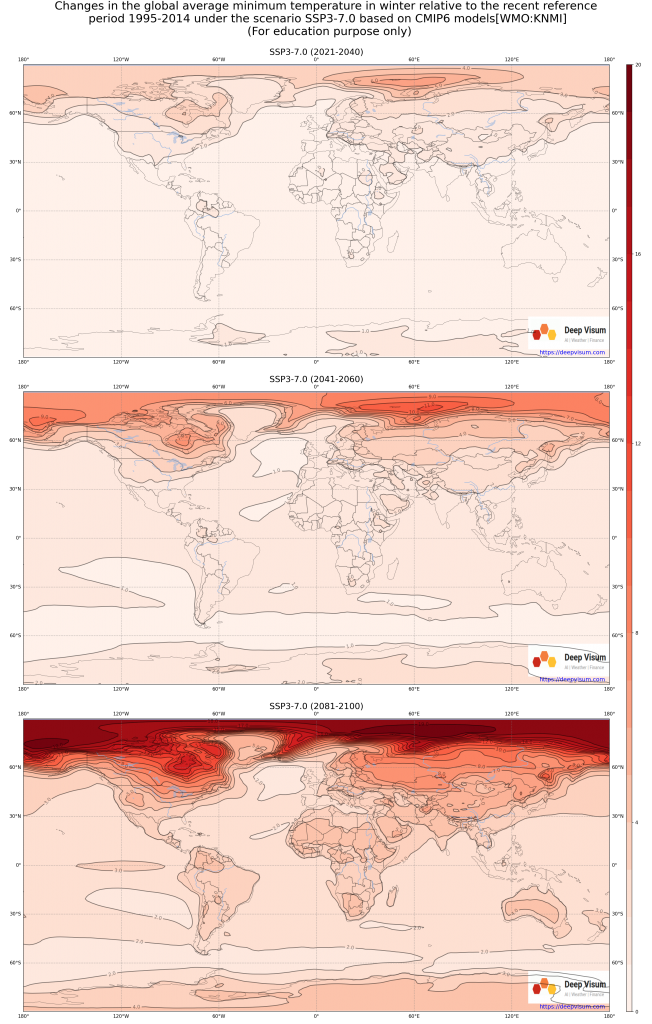
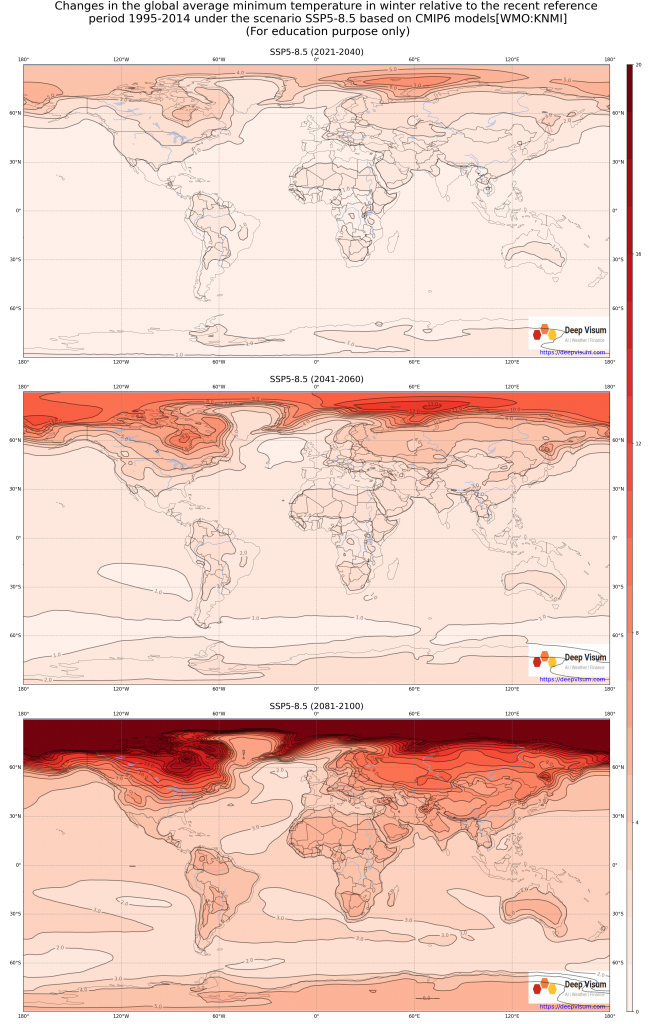
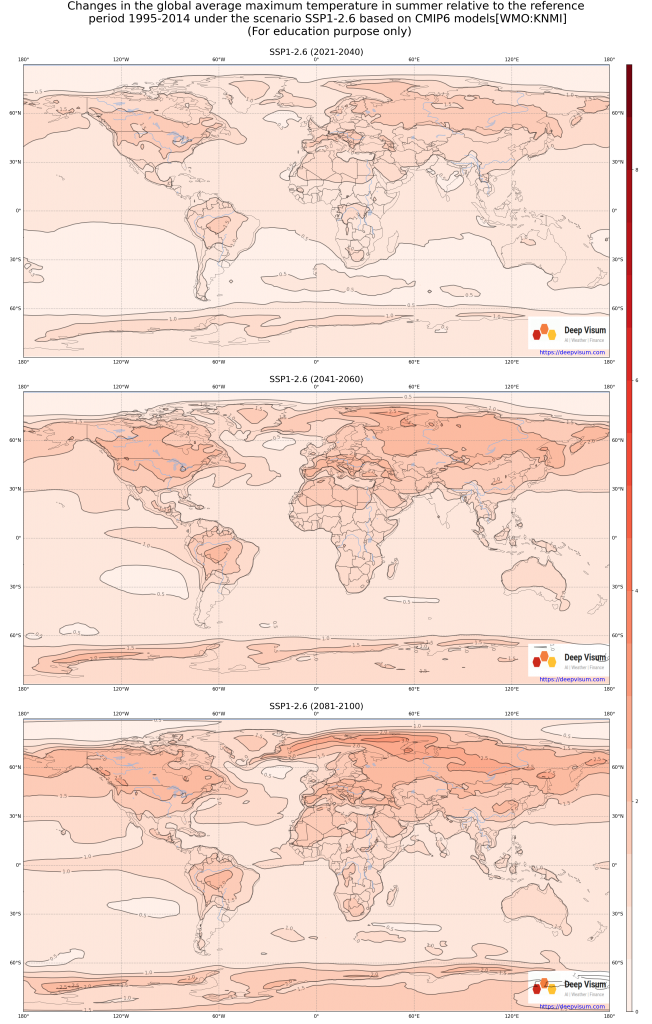
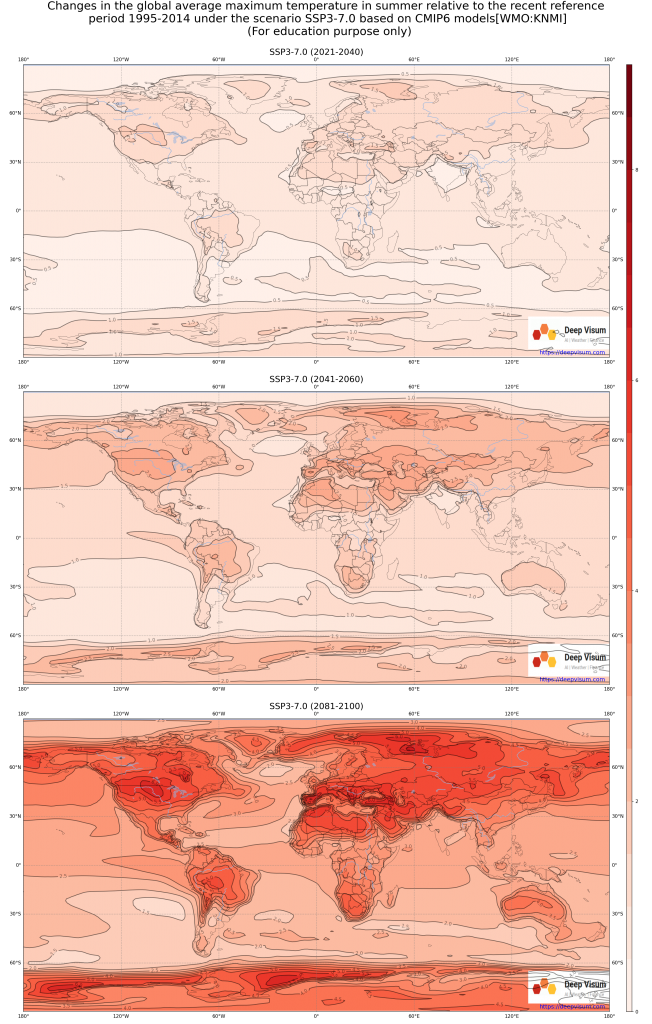
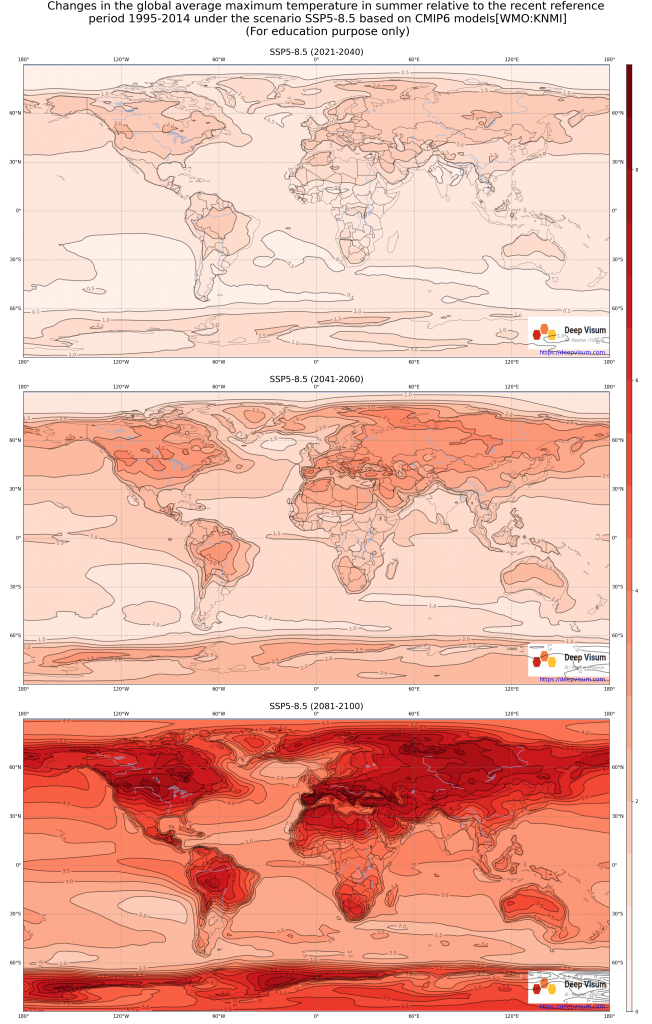
Averaged Summer Daily Maximum Temperature🔝
Annual Total Precipitation🔝
Climate Change in Canada🔝
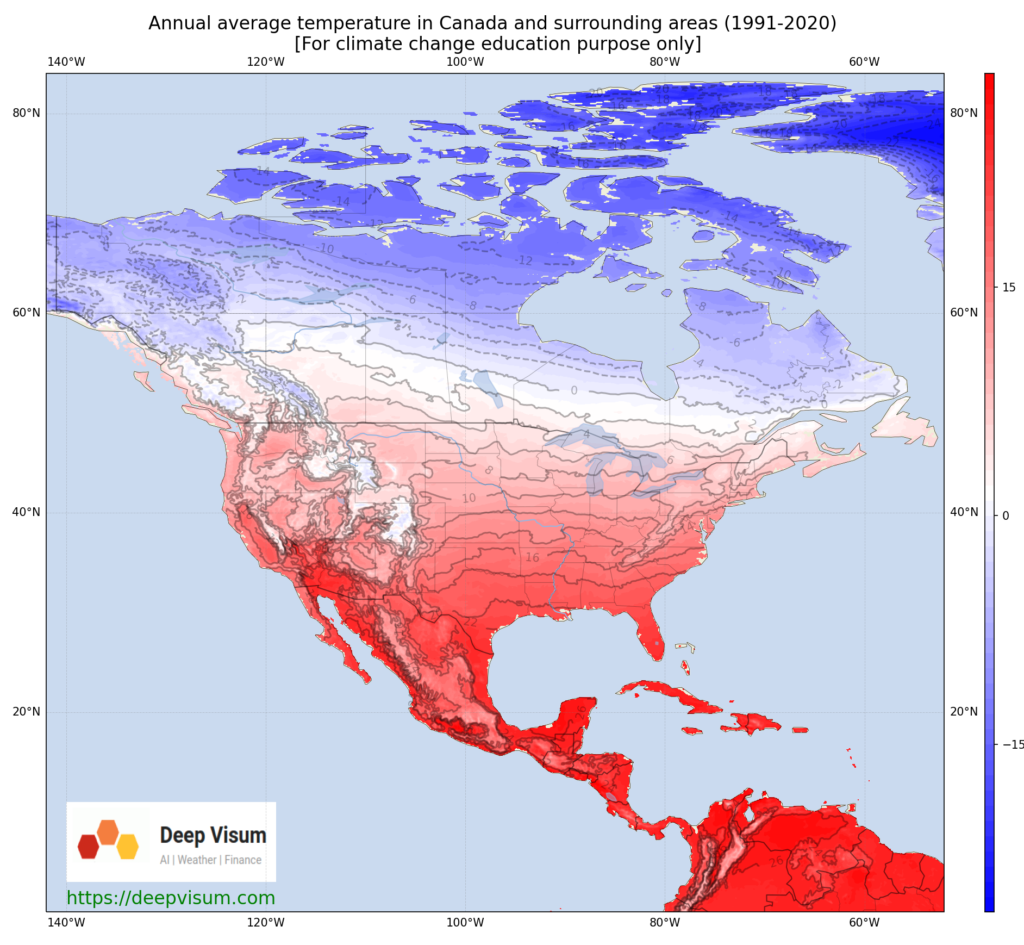
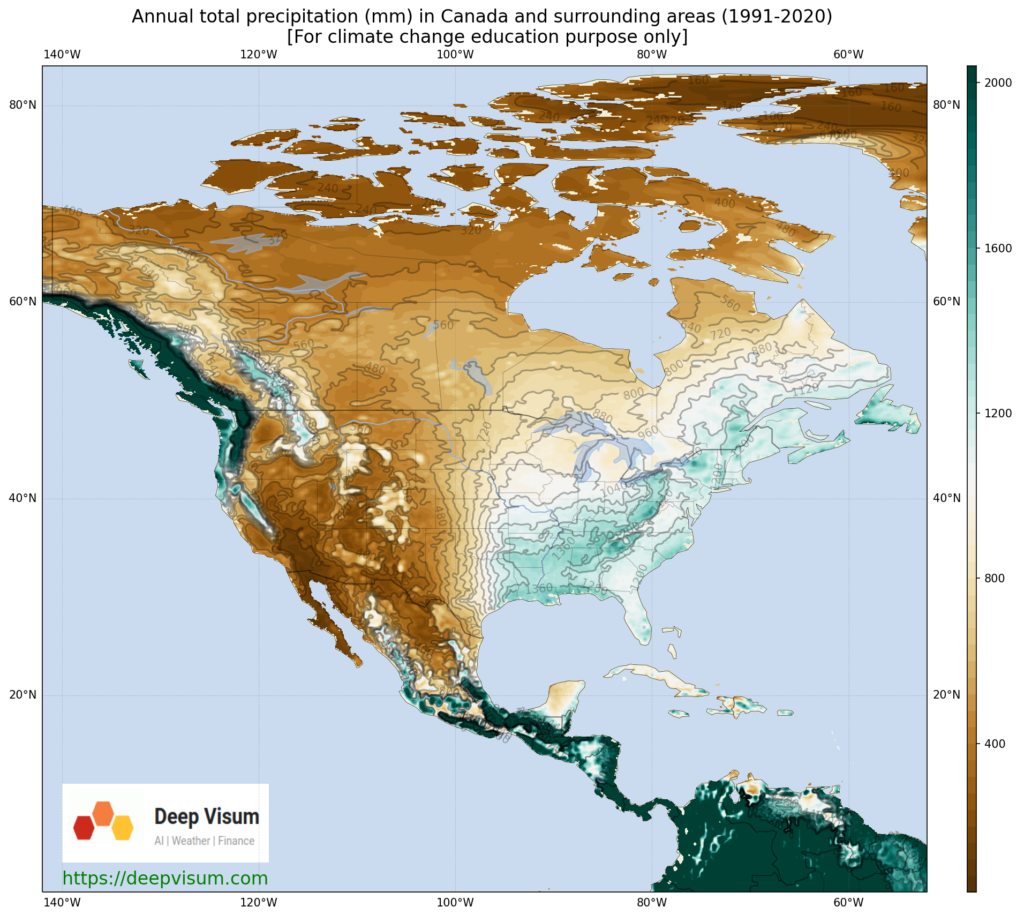
Climate Normal (1991-2020)🔝
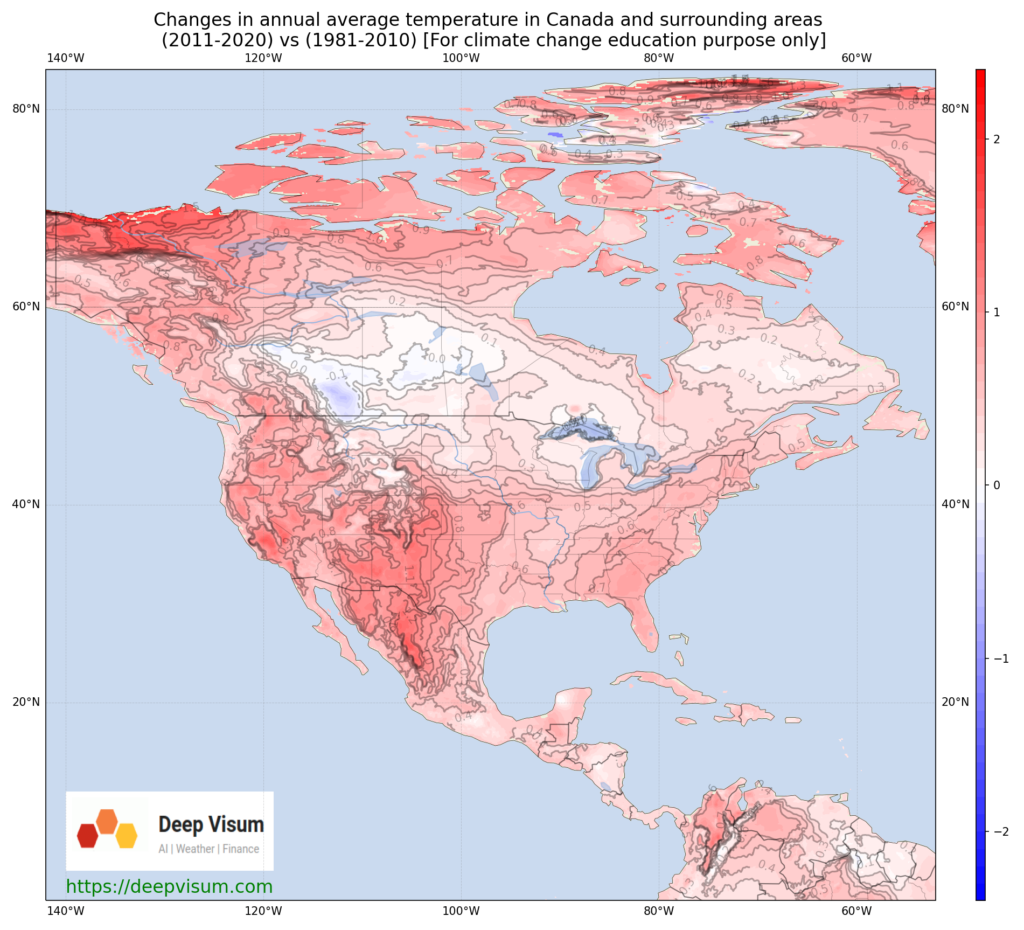
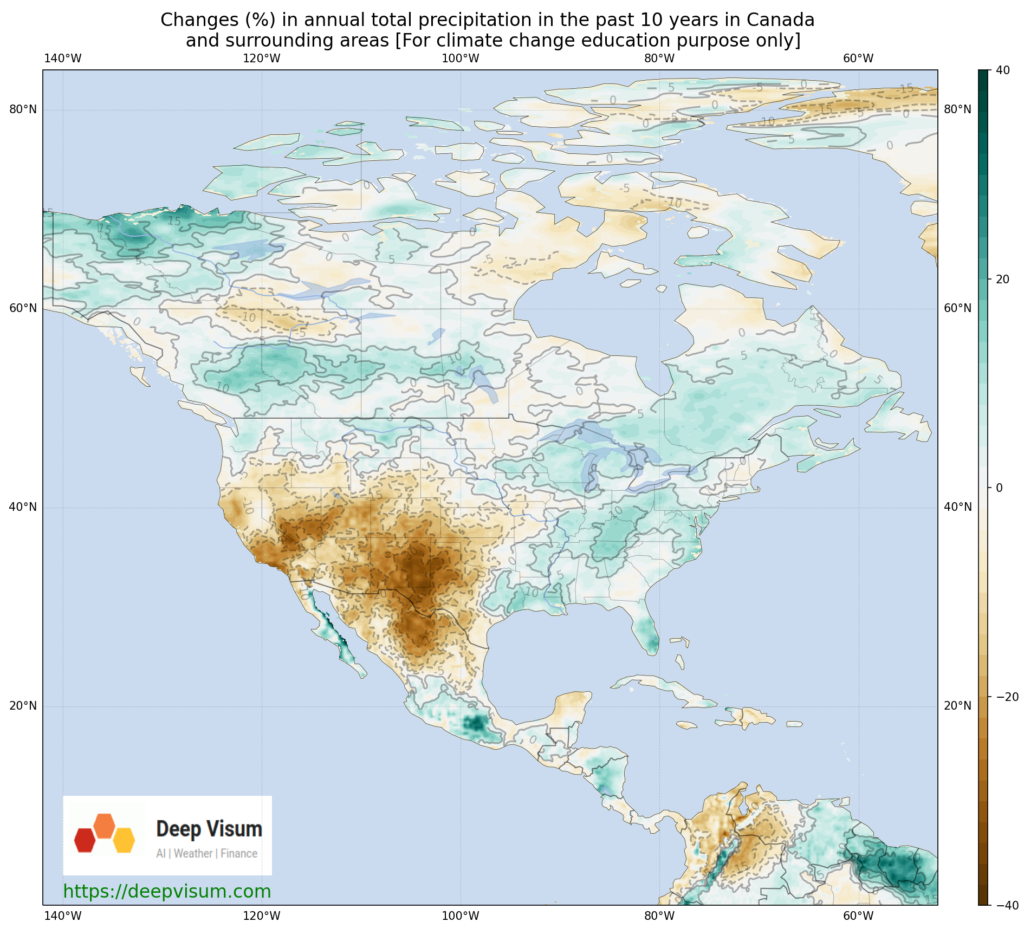
Change in the past 10 years (2011-2020 vs 1981-2010)🔝
Change in the future under different Shared Socioeconomic Pathways (SSPs)🔝
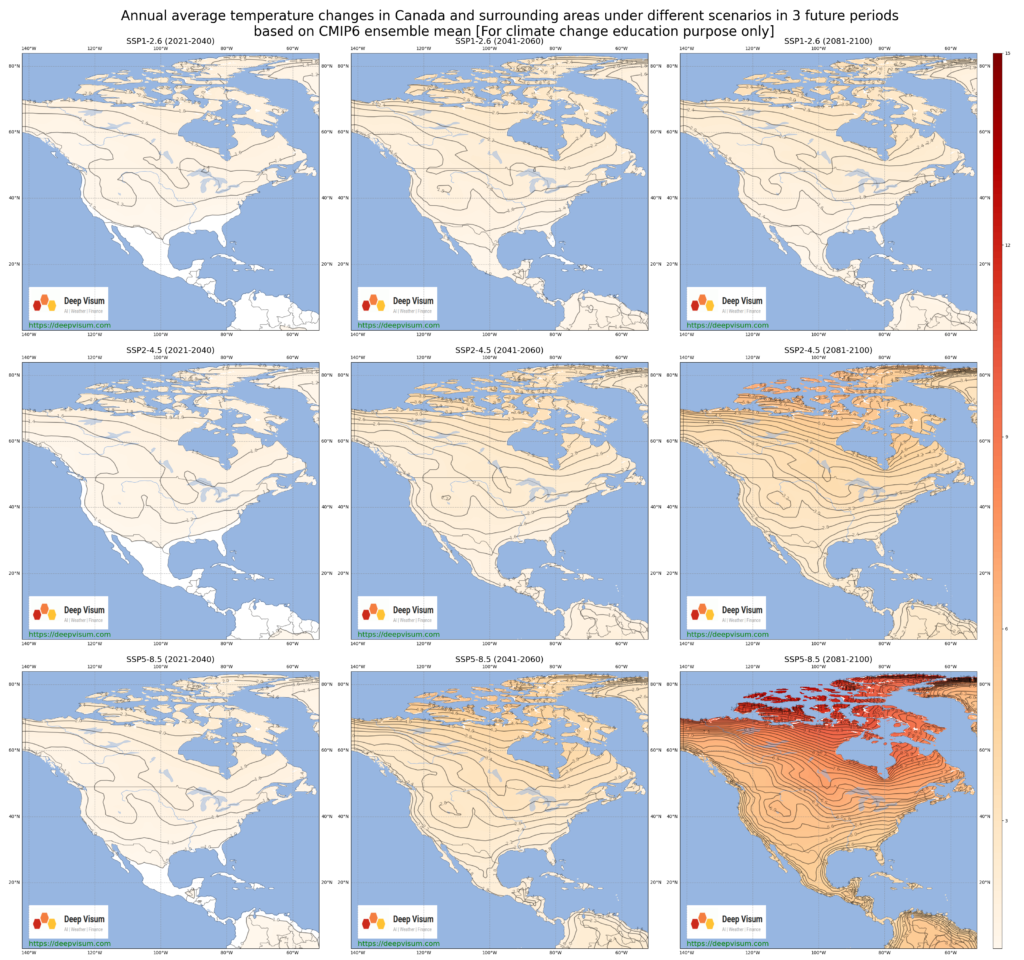
Annual mean temperature change under SSP1-2.6, SSP2-4.5 and SSP5-8.5 in 2021-2040, 2041-2060 and 2081-2100🔝
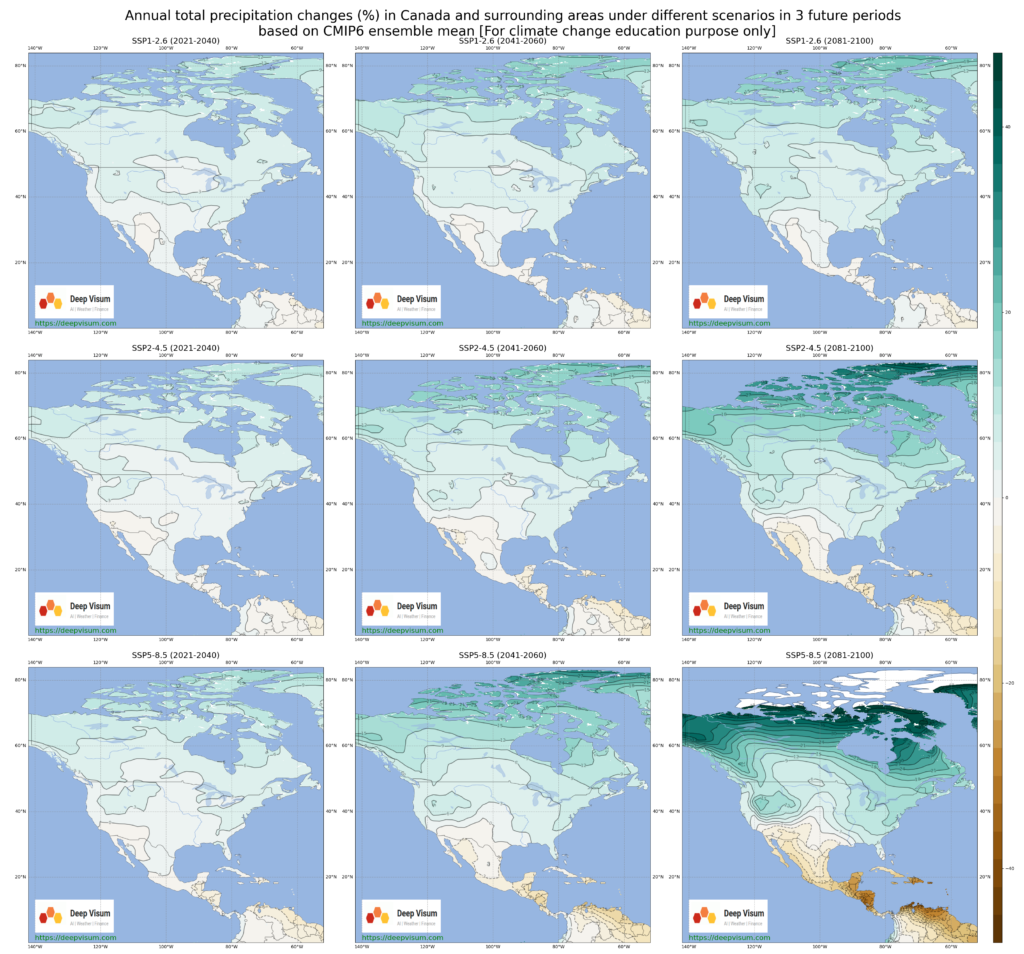
Annual total precipitation changes(%) under SSP1-2.6, SSP2-4.5 and SSP5-8.5 in 2021-2040, 2041-2060 and 2081-2100🔝
Climate Change in China🔝
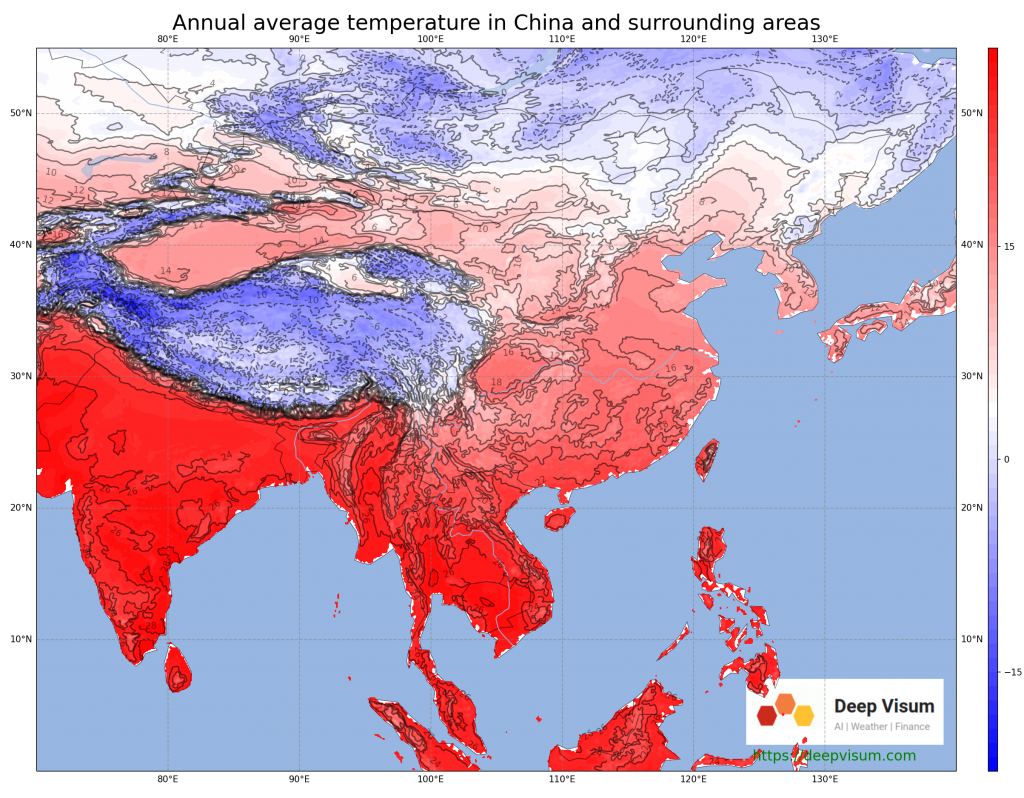
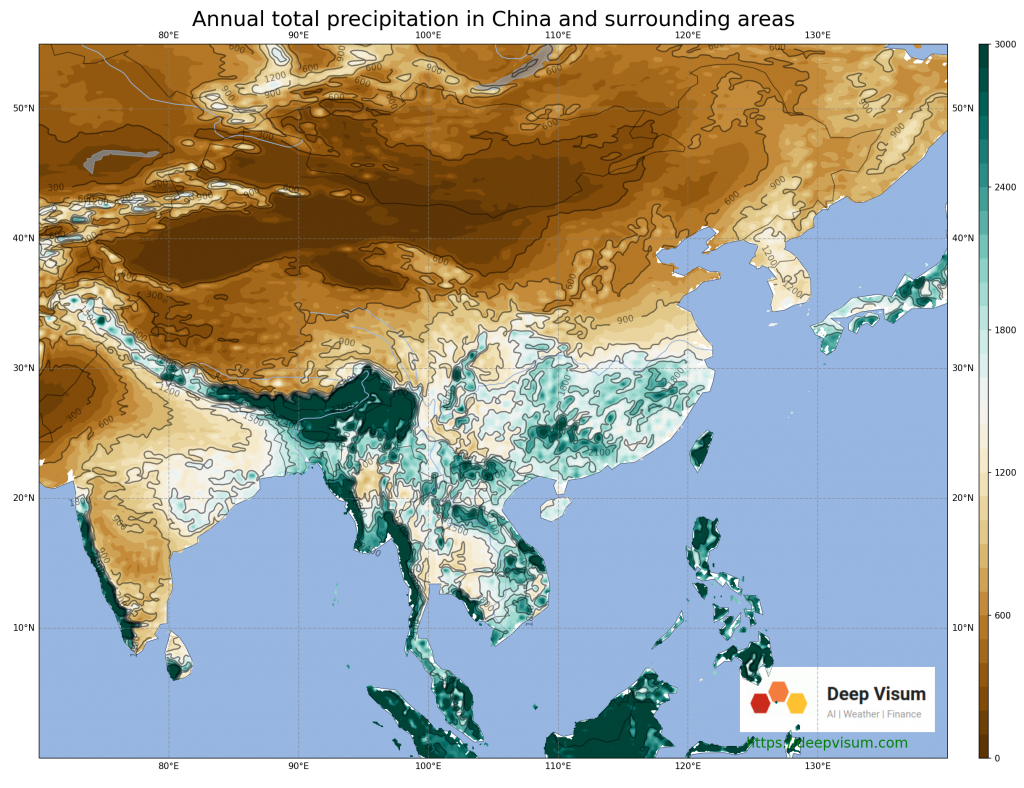
Climate Normal (1991-2020)🔝
Change in the past 10 years (2011-2020 vs 1981-2010)🔝
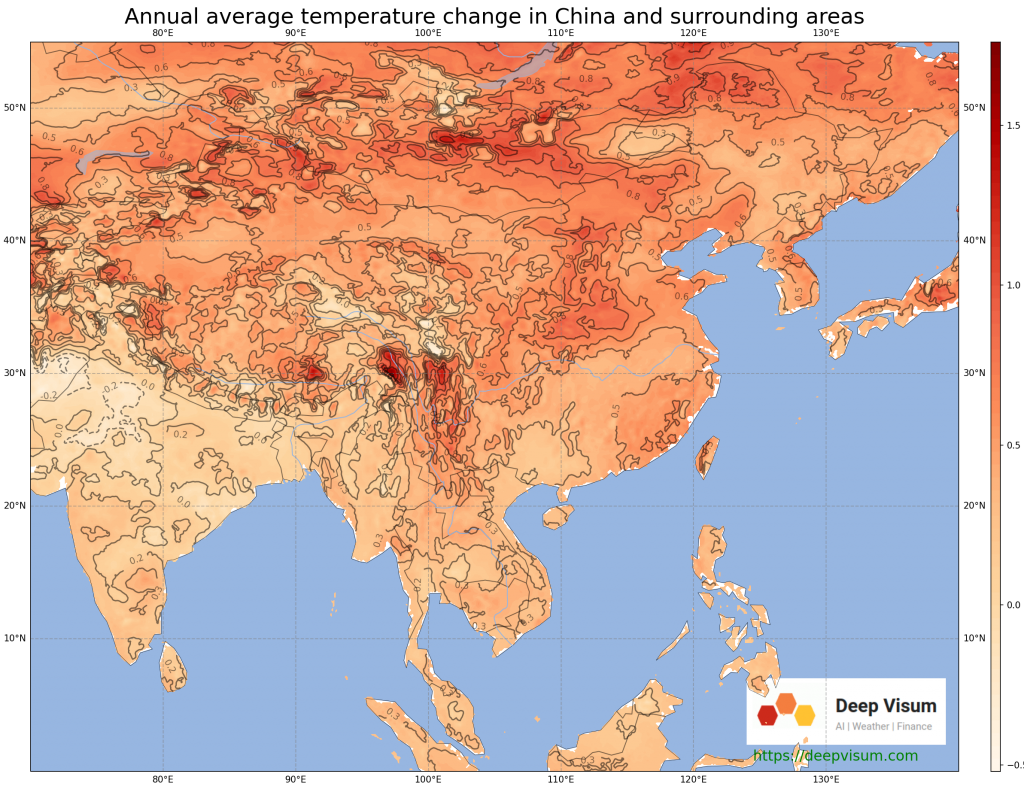
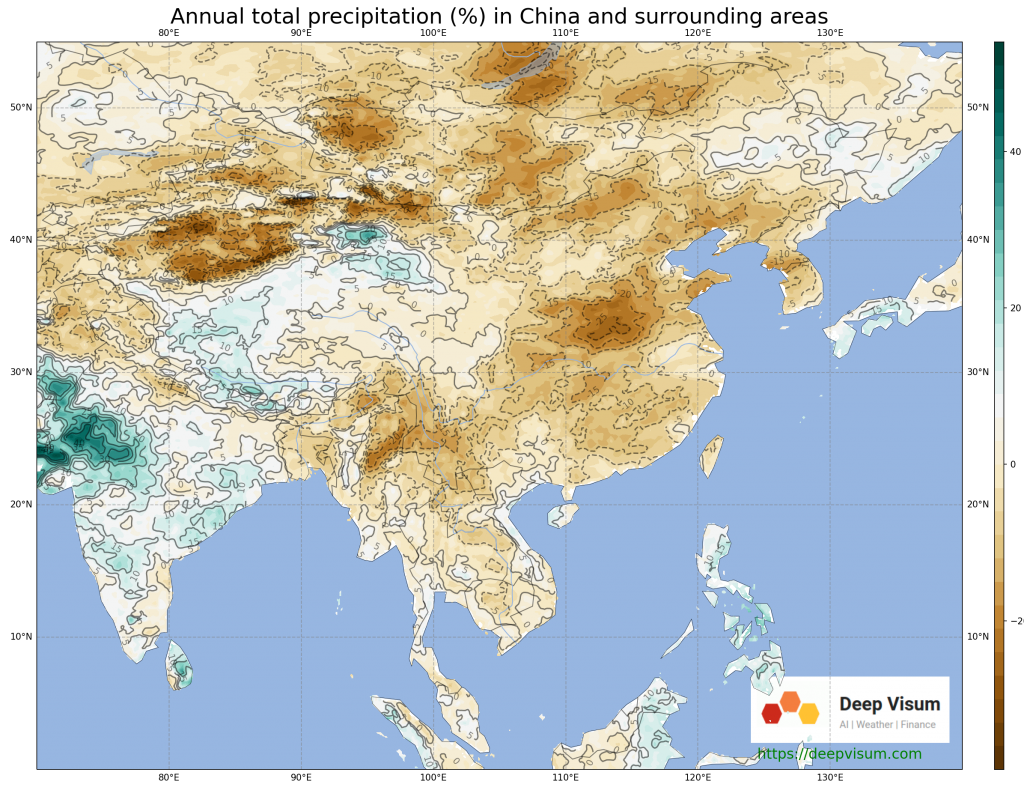
Change in the future under different Shared Socioeconomic Pathways (SSPs)🔝
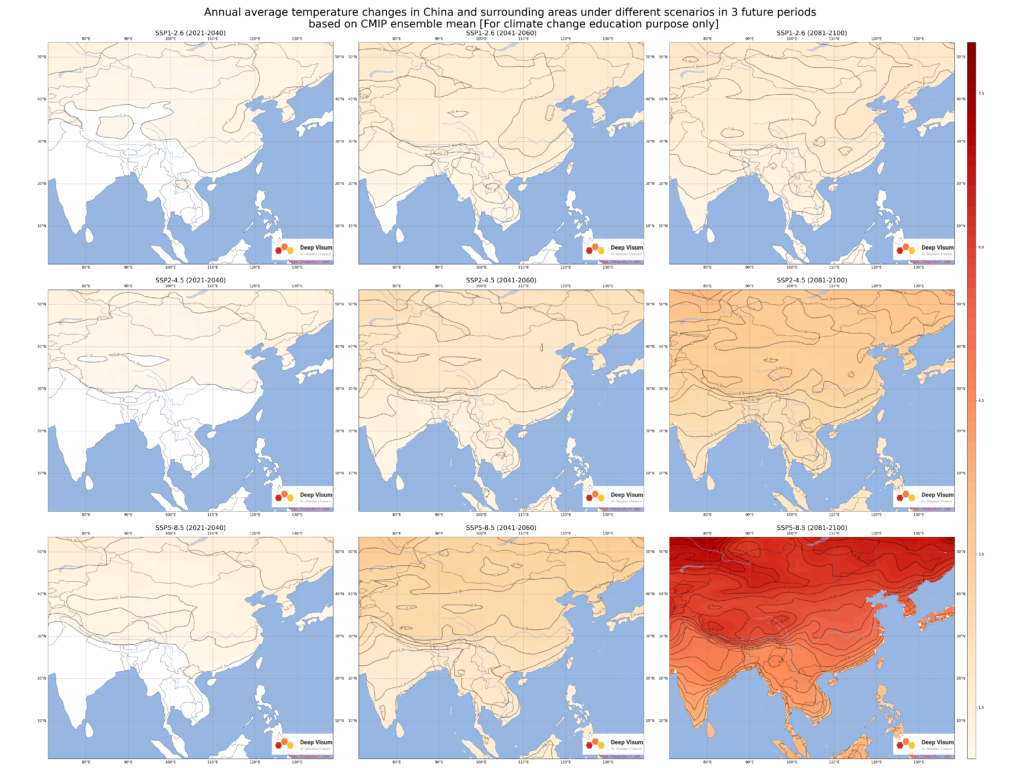
Annual mean temperature change under SSP1-2.6, SSP2-4.5 and SSP5-8.5 in 2021-2040, 2041-2060 and 2081-2100🔝
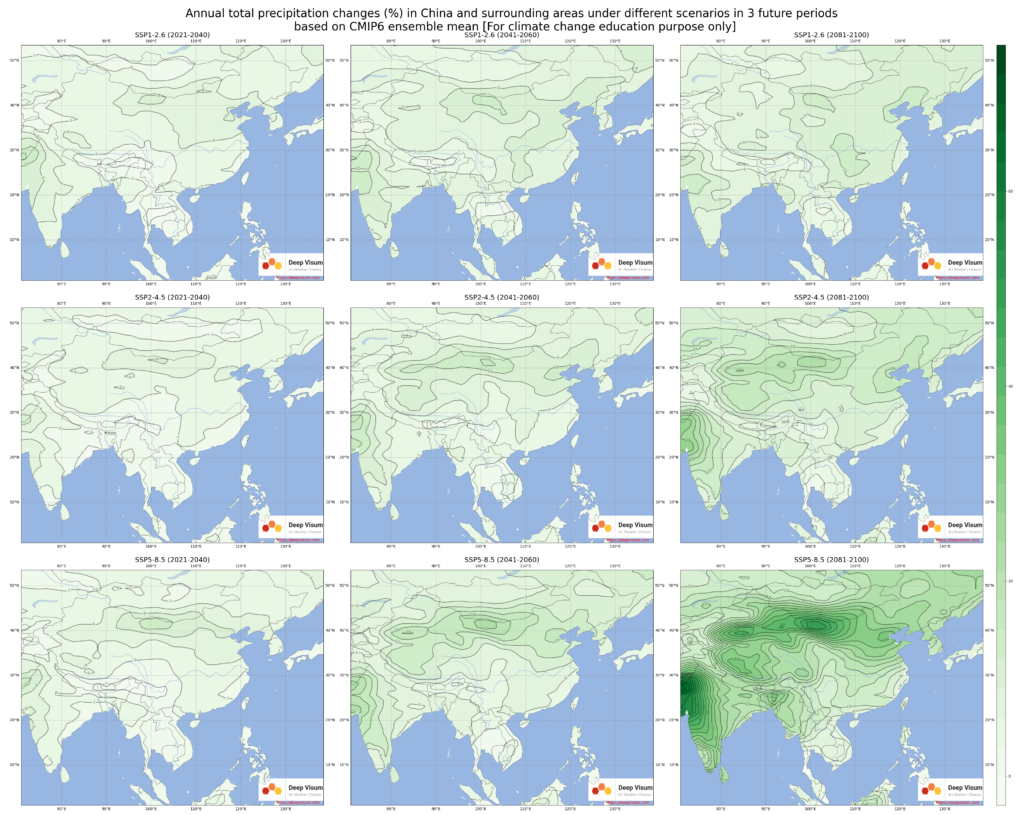
Annual total precipitation change under SSP1-2.6, SSP2-4.5 and SSP5-8.5 in 2021-2040, 2041-2060 and 2081-2100🔝
Notes🔝
Glossary🔝
Shared Socioeconomic Pathways (SSPs)🔝
The SSPs are based on five narratives describing broad socioeconomic trends that could shape future society.
| SSP1 | Sustainability – Taking the Green Road (Low challenges to mitigation and adaptation) The world shifts gradually, but pervasively, toward a more sustainable path, emphasizing more inclusive development that respects perceived environmental boundaries. Management of the global commons slowly improves, educational and health investments accelerate the demographic transition, and the emphasis on economic growth shifts toward a broader emphasis on human well-being. Driven by an increasing commitment to achieving development goals, inequality is reduced both across and within countries. Consumption is oriented toward low material growth and lower resource and energy intensity. |
| SSP2 | Middle of the Road (Medium challenges to mitigation and adaptation) The world follows a path in which social, economic, and technological trends do not shift markedly from historical patterns. Development and income growth proceeds unevenly, with some countries making relatively good progress while others fall short of expectations. Global and national institutions work toward but make slow progress in achieving sustainable development goals. Environmental systems experience degradation, although there are some improvements and overall the intensity of resource and energy use declines. Global population growth is moderate and levels off in the second half of the century. Income inequality persists or improves only slowly and challenges to reducing vulnerability to societal and environmental changes remain. |
| SSP3 | Regional Rivalry – A Rocky Road (High challenges to mitigation and adaptation) A resurgent nationalism, concerns about competitiveness and security, and regional conflicts push countries to increasingly focus on domestic or, at most, regional issues. Policies shift over time to become increasingly oriented toward national and regional security issues. Countries focus on achieving energy and food security goals within their own regions at the expense of broader-based development. Investments in education and technological development decline. Economic development is slow, consumption is material-intensive, and inequalities persist or worsen over time. Population growth is low in industrialized and high in developing countries. A low international priority for addressing environmental concerns leads to strong environmental degradation in some regions. |
| SSP4 | Inequality – A Road Divided (Low challenges to mitigation, high challenges to adaptation) Highly unequal investments in human capital, combined with increasing disparities in economic opportunity and political power, lead to increasing inequalities and stratification both across and within countries. Over time, a gap widens between an internationally-connected society that contributes to knowledge- and capital-intensive sectors of the global economy, and a fragmented collection of lower-income, poorly educated societies that work in a labor intensive, low-tech economy. Social cohesion degrades and conflict and unrest become increasingly common. Technology development is high in the high-tech economy and sectors. The globally connected energy sector diversifies, with investments in both carbon-intensive fuels like coal and unconventional oil, but also low-carbon energy sources. Environmental policies focus on local issues around middle and high income areas. |
| SSP5 | Fossil-fueled Development – Taking the Highway (High challenges to mitigation, low challenges to adaptation) This world places increasing faith in competitive markets, innovation and participatory societies to produce rapid technological progress and development of human capital as the path to sustainable development. Global markets are increasingly integrated. There are also strong investments in health, education, and institutions to enhance human and social capital. At the same time, the push for economic and social development is coupled with the exploitation of abundant fossil fuel resources and the adoption of resource and energy intensive lifestyles around the world. All these factors lead to rapid growth of the global economy, while global population peaks and declines in the 21st century. Local environmental problems like air pollution are successfully managed. There is faith in the ability to effectively manage social and ecological systems, including by geo-engineering if necessary. |
Representative Concentration Pathways (RCPs)🔝
| Description | IA Model | Publication – IA Model | |
| RCP8.5 | Rising radiative forcing pathway leading to 8.5 W/m2 in 2100. | MESSAGE | Riahi et al. (2007) Rao & Riahi (2006) |
| RCP6 | Stabilization without overshoot pathway to 6 W/m2 at stabilization after 2100 | AIM | Fujino et al. (2006) Hijioka et al. (2008) |
| RCP4.5 | Stabilization without overshoot pathway to 4.5 W/m2 at stabilization after 2100 | GCAM (MiniCAM) | Smith and Wigley (2006) Clarke et al. (2007) Wise et al. (2009) |
| RCP2.6 | Peak in radiative forcing at ~ 3 W/m2 before 2100 and decline | IMAGE | van Vuuren et al. (2006; 2007) |
Data Sources🔝
ERA5🔝
ERA5-Land is a reanalysis dataset providing a consistent view of the evolution of land variables over several decades at an enhanced resolution compared to ERA5. ERA5-Land has been produced by replaying the land component of the ECMWF ERA5 climate reanalysis. Reanalysis combines model data with observations from across the world into a globally complete and consistent dataset using the laws of physics. Reanalysis produces data that goes several decades back in time, providing an accurate description of the climate of the past.
https://cds.climate.copernicus.eu/cdsapp#!/dataset/reanalysis-era5-land-monthly-means?tab=overview; https://confluence.ecmwf.int/display/CKB/ERA5-Land%3A+data+documentation
CRU v. 4.05🔝
CRU TS (Climatic Research Unit gridded Time Series) is a widely used climate dataset on a 0.5° latitude by 0.5° longitude grid over all land domains of the world except Antarctica. It is derived by the interpolation of monthly climate anomalies from extensive networks of weather station observations.The resulting anomaly grids are converted to actuals (actual values, ie, not anomalies) for publication using the CRU CL v1.0 climatologies.
Harris, I., Osborn, T.J., Jones, P. et al. Version 4 of the CRU TS monthly high-resolution gridded multivariate climate dataset. Sci Data 7, 109 (2020). https://doi.org/10.1038/s41597-020-0453-3
CMIP6🔝
Coupled Model Intercomparison Project Phase 6.
The Scenario Model Intercomparison Project (ScenarioMIP) defines and coordinates the main set of future climate projections, based on concentration-driven simulations, within the Coupled Model Intercomparison Project phase 6 (CMIP6).The range of future temperature and precipitation changes by the end of the century (2081–2100) encompassing the Tier 1 experiments based on the Shared Socioeconomic Pathway (SSP) scenarios (SSP1-2.6, SSP2-4.5, SSP3-7.0 and SSP5-8.5) and SSP1-1.9 spans a larger range of outcomes compared to CMIP5, due to higher warming (by close to 1.5 ∘C) reached at the upper end of the 5 %–95 % envelope of the highest scenario (SSP5-8.5).
Climate model projections from the Scenario Model Intercomparison Project (ScenarioMIP) of CMIP6; https://esd.copernicus.org/articles/12/253/2021/; Monthly CMIP6 scenario runs:https://climexp.knmi.nl/selectfield_cmip6.cgi?id=someone@somewhere