Table of Contents
Indicators, signals and candlestick patterns of 2200+ NASDAQ stocks
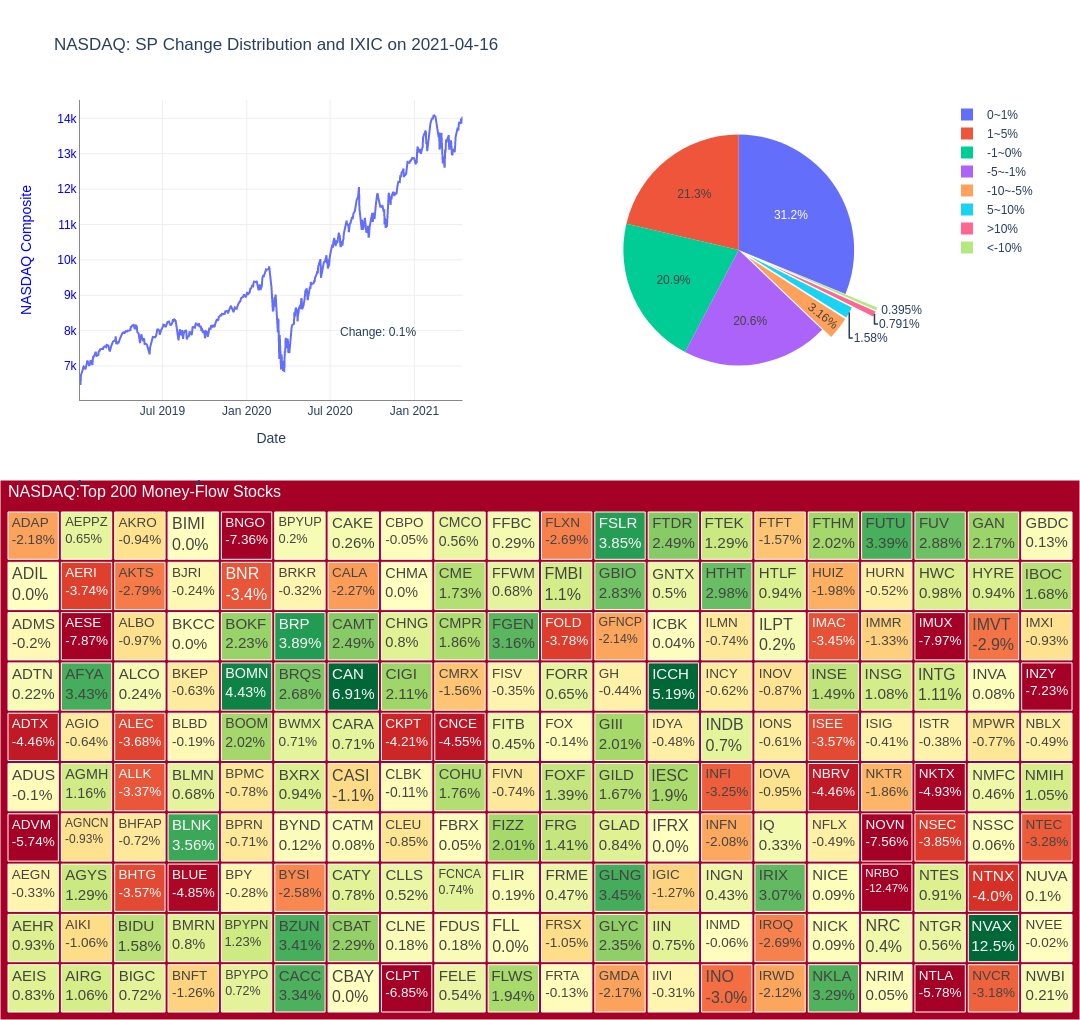
Market Summary
Stock Screener
- The table is used to find today’s top gainers, top loser, top money flow, most active, golden crosses, death crosses, bullish, bearish, overbought, oversold, trend strength, direction, etc.
- Sort the coresponding column of the following table to find what you want on the top rows.
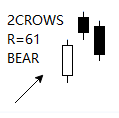
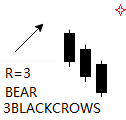
- You can directly input key word to find stocks that match your condition. For example, ‘bullish’, ‘Yes’, ‘2CROWS’, ‘3BLACKCROWS’, etc.
| ID | Symbols | Close | Volume | Change | MF | ROC | PATTERN | nPATTERN | BULL | GLD50 | GLD20 | GLD10 | DIE50 | DIE20 | DIE10 | MFI | RSI | TSI | SR | SRs | WR | UO | MI | ADX | ADX+ | ADX- |
|---|---|---|---|---|---|---|---|---|---|---|---|---|---|---|---|---|---|---|---|---|---|---|---|---|---|---|
| 0 | ADAP | 4.93 | 748.0 | -2.18 | 3.0 | -2.38 | HAMMER | 1.0 | Bullish | No | No | No | No | No | No | 48.0 | 42.0 | -9.0 | 12.0 | 20.0 | -87.0 | 42.0 | 24.0 | 10.0 | 20.0 | 21.0 |
| 1 | ADIL | 2.19 | 86.0 | 0.0 | 0.0 | -4.78 | MATCHINGLOW | 1.0 | Bullish | No | No | No | No | No | No | 39.0 | 42.0 | -9.0 | 20.0 | 28.0 | -79.0 | 44.0 | 22.0 | 15.0 | 14.0 | 23.0 |
| 2 | ADMS | 5.09 | 1130.0 | -0.2 | 5.0 | 6.04 | DOJI HIGHWAVE LONGLEGGEDDOJI SPINNINGTOP | 4.0 | Bullish | No | No | No | No | No | No | 40.0 | 52.0 | -7.0 | 78.0 | 73.0 | -21.0 | 64.0 | 23.0 | 14.0 | 20.0 | 18.0 |
| 3 | ADTN | 18.46 | 136.0 | 0.22 | 2.0 | 11.74 | None | 0.0 | None | No | No | No | No | No | No | 65.0 | 58.0 | 12.0 | 86.0 | 87.0 | -13.0 | 59.0 | 23.0 | 15.0 | 26.0 | 21.0 |
| 4 | ADTX | 2.57 | 356.0 | -4.46 | 0.0 | -0.39 | 3OUTSIDE | -1.0 | Bearish | Yes | No | No | No | No | No | 45.0 | 42.0 | -9.0 | 13.0 | 30.0 | -86.0 | 50.0 | 23.0 | 14.0 | 18.0 | 23.0 |
| 5 | ADUS | 108.35 | 38.0 | -0.1 | 4.0 | 2.61 | SHORTLINE | -1.0 | Bearish | No | No | No | No | No | No | 63.0 | 53.0 | -2.0 | 80.0 | 65.0 | -19.0 | 56.0 | 22.0 | 8.0 | 24.0 | 20.0 |
| 6 | ADVM | 8.86 | 1046.0 | -5.74 | 9.0 | -6.24 | BELTHOLD | -1.0 | Bearish | No | No | No | No | No | No | 40.0 | 37.0 | -21.0 | 12.0 | 21.0 | -87.0 | 36.0 | 23.0 | 29.0 | 14.0 | 30.0 |
| 7 | AEGN | 30.56 | 480.0 | -0.33 | 14.0 | 5.93 | BELTHOLD CLOSINGMARUBOZU HIKKAKE LONGLINE MARUBOZU | -5.0 | Bearish | No | No | No | No | No | No | 56.0 | 71.0 | 34.0 | 86.0 | 91.0 | -13.0 | 62.0 | 26.0 | 43.0 | 34.0 | 8.0 |
| 8 | AEHR | 2.18 | 132.0 | 0.93 | 0.0 | -8.4 | SPINNINGTOP | 1.0 | Bullish | No | No | No | No | No | No | 37.0 | 39.0 | -12.0 | 18.0 | 10.0 | -81.0 | 35.0 | 22.0 | 12.0 | 14.0 | 24.0 |
| 9 | AEIS | 116.75 | 195.0 | 0.83 | 22.0 | 10.16 | SHORTLINE SPINNINGTOP | 2.0 | Bullish | No | No | No | No | No | No | 54.0 | 56.0 | 13.0 | 70.0 | 65.0 | -29.0 | 51.0 | 23.0 | 18.0 | 27.0 | 19.0 |
| 10 | AEPPZ | 51.22 | 14.0 | 0.65 | 0.0 | 4.17 | SHORTLINE | 1.0 | Bullish | No | No | No | No | No | No | 50.0 | 69.0 | 29.0 | 98.0 | 95.0 | -1.0 | 66.0 | 23.0 | 39.0 | 33.0 | 7.0 |
| 11 | AERI | 17.25 | 480.0 | -3.74 | 8.0 | -3.2 | BELTHOLD LONGLINE | -2.0 | Bearish | No | No | No | No | No | No | 49.0 | 40.0 | -4.0 | 28.0 | 47.0 | -71.0 | 47.0 | 24.0 | 19.0 | 14.0 | 24.0 |
| 12 | AESE | 2.34 | 2265.0 | -7.87 | 5.0 | -18.75 | BELTHOLD HIKKAKE LONGLINE | -4.0 | Bearish | No | No | No | No | No | No | 37.0 | 39.0 | -4.0 | 3.0 | 12.0 | -96.0 | 43.0 | 23.0 | 26.0 | 19.0 | 19.0 |
| 13 | AFYA | 23.82 | 320.0 | 3.43 | 7.0 | 25.37 | BELTHOLD | 1.0 | Bullish | No | No | No | No | No | No | 66.0 | 68.0 | 11.0 | 87.0 | 85.0 | -12.0 | 68.0 | 24.0 | 28.0 | 34.0 | 13.0 |
| 14 | AGIO | 54.69 | 1100.0 | -0.64 | 60.0 | 11.05 | DOJI HARAMI HARAMICROSS HIGHWAVE LONGLEGGEDDOJI RICKSHAWMAN SPINNINGTOP | -1.0 | Bearish | No | Yes | No | No | No | No | 54.0 | 58.0 | 10.0 | 86.0 | 86.0 | -13.0 | 52.0 | 23.0 | 14.0 | 21.0 | 12.0 |
| 15 | AGMH | 12.17 | 0.0 | 1.16 | 0.0 | 2.96 | SHORTLINE | 1.0 | Bullish | No | No | No | No | No | No | 44.0 | 38.0 | -30.0 | 47.0 | 26.0 | -52.0 | 48.0 | 22.0 | 23.0 | 22.0 | 30.0 |
| 16 | AGNCN | 25.63 | 35.0 | -0.93 | 0.0 | -0.89 | CLOSINGMARUBOZU | -1.0 | Bearish | No | No | No | No | No | No | 51.0 | 48.0 | 2.0 | 45.0 | 64.0 | -54.0 | 42.0 | 23.0 | 13.0 | 15.0 | 15.0 |
| 17 | AGYS | 50.44 | 90.0 | 1.29 | 4.0 | 8.43 | SPINNINGTOP | 1.0 | Bullish | No | No | No | No | No | No | 65.0 | 48.0 | -8.0 | 85.0 | 76.0 | -14.0 | 53.0 | 23.0 | 15.0 | 17.0 | 18.0 |
| 18 | AIKI | 0.89 | 4029.0 | -1.06 | 3.0 | -21.89 | DOJI DOJISTAR HIGHWAVE LONGLEGGEDDOJI SPINNINGTOP | 1.0 | Bullish | No | No | No | No | No | No | 22.0 | 31.0 | -23.0 | 17.0 | 11.0 | -82.0 | 37.0 | 21.0 | 18.0 | 16.0 | 33.0 |
| 19 | AIRG | 20.94 | 60.0 | 1.06 | 1.0 | 3.71 | SHORTLINE | 1.0 | Bullish | No | No | No | No | No | No | 44.0 | 45.0 | -8.0 | 46.0 | 39.0 | -53.0 | 48.0 | 22.0 | 16.0 | 17.0 | 22.0 |
| 20 | AKRO | 27.34 | 147.0 | -0.94 | 4.0 | -3.73 | None | 0.0 | None | No | No | No | No | No | No | 24.0 | 40.0 | -19.0 | 28.0 | 30.0 | -71.0 | 40.0 | 23.0 | 15.0 | 15.0 | 20.0 |
| 21 | AKTS | 11.85 | 555.0 | -2.79 | 6.0 | -7.49 | CLOSINGMARUBOZU ENGULFING | -2.0 | Bearish | No | No | No | No | No | No | 42.0 | 39.0 | -16.0 | 10.0 | 16.0 | -89.0 | 52.0 | 22.0 | 20.0 | 18.0 | 26.0 |
| 22 | ALBO | 32.6 | 93.0 | -0.97 | 3.0 | -3.61 | DOJI HARAMI HARAMICROSS HIGHWAVE LONGLEGGEDDOJI RICKSHAWMAN SPINNINGTOP | -1.0 | Bearish | No | No | No | No | No | No | 37.0 | 41.0 | -14.0 | 15.0 | 16.0 | -84.0 | 36.0 | 23.0 | 15.0 | 17.0 | 20.0 |
| 23 | ALCO | 29.32 | 21.0 | 0.24 | 0.0 | -1.51 | None | 0.0 | None | No | No | No | No | No | No | 55.0 | 46.0 | -12.0 | 44.0 | 40.0 | -55.0 | 52.0 | 23.0 | 26.0 | 10.0 | 18.0 |
| 24 | ALEC | 17.8 | 724.0 | -3.68 | 12.0 | 1.6 | BELTHOLD | -1.0 | Bearish | No | No | No | No | No | Yes | 58.0 | 47.0 | -1.0 | 35.0 | 46.0 | -64.0 | 45.0 | 24.0 | 12.0 | 23.0 | 27.0 |
| 25 | ALLK | 104.5 | 125.0 | -3.37 | 13.0 | -4.77 | BELTHOLD CLOSINGMARUBOZU ENGULFING EVENINGDOJISTAR EVENINGSTAR LONGLINE MARUBOZU | -7.0 | Bearish | No | No | No | No | No | No | 33.0 | 37.0 | -22.0 | 20.0 | 35.0 | -79.0 | 40.0 | 23.0 | 34.0 | 11.0 | 27.0 |
| 26 | BHFAP | 27.66 | 23.0 | -0.72 | 0.0 | 1.92 | BELTHOLD ENGULFING | -2.0 | Bearish | No | No | No | No | No | No | 64.0 | 56.0 | 22.0 | 63.0 | 74.0 | -36.0 | 51.0 | 24.0 | 29.0 | 23.0 | 15.0 |
| 27 | BHTG | 1.35 | 1264.0 | -3.57 | 1.0 | -15.62 | HIKKAKE | 1.0 | Bullish | No | No | No | No | No | No | 61.0 | 38.0 | -16.0 | 11.0 | 10.0 | -88.0 | 43.0 | 22.0 | 11.0 | 18.0 | 24.0 |
| 28 | BIDU | 213.56 | 5538.0 | 1.58 | 1182.0 | -2.14 | HARAMI SPINNINGTOP | 2.0 | Bullish | No | No | No | No | No | No | 76.0 | 39.0 | -19.0 | 54.0 | 63.0 | -45.0 | 48.0 | 21.0 | 32.0 | 15.0 | 31.0 |
| 29 | BIGC | 59.79 | 823.0 | 0.72 | 49.0 | 12.01 | None | 0.0 | None | No | No | No | No | No | No | 61.0 | 52.0 | -4.0 | 94.0 | 93.0 | -5.0 | 66.0 | 22.0 | 21.0 | 21.0 | 24.0 |
| 30 | BIMI | 1.48 | 349.0 | 0.0 | 0.0 | -15.43 | HAMMER | 1.0 | Bullish | No | No | No | No | No | No | 55.0 | 31.0 | -21.0 | 15.0 | 9.0 | -84.0 | 38.0 | 22.0 | 16.0 | 14.0 | 28.0 |
| 31 | BJRI | 58.69 | 483.0 | -0.24 | 28.0 | -3.04 | None | 0.0 | None | No | No | No | No | No | No | 47.0 | 51.0 | 6.0 | 40.0 | 49.0 | -59.0 | 42.0 | 24.0 | 10.0 | 17.0 | 17.0 |
| 32 | BKCC | 3.65 | 190.0 | 0.0 | 0.0 | 9.94 | HIKKAKE SHORTLINE | -2.0 | Bearish | No | No | No | No | No | No | 74.0 | 59.0 | 20.0 | 63.0 | 62.0 | -36.0 | 46.0 | 24.0 | 28.0 | 25.0 | 15.0 |
| 33 | BKEP | 3.16 | 172.0 | -0.63 | 0.0 | 1.61 | DOJI DRAGONFLYDOJI HAMMER LONGLEGGEDDOJI SHORTLINE | 3.0 | Bullish | No | No | No | No | No | No | 44.0 | 51.0 | 14.0 | 17.0 | 18.0 | -82.0 | 45.0 | 25.0 | 32.0 | 21.0 | 16.0 |
| 34 | BLBD | 26.27 | 156.0 | -0.19 | 4.0 | 7.89 | ENGULFING SHORTLINE | -2.0 | Bearish | No | No | No | No | No | No | 58.0 | 54.0 | 9.0 | 64.0 | 64.0 | -35.0 | 60.0 | 23.0 | 12.0 | 21.0 | 20.0 |
| 35 | BLMN | 28.16 | 845.0 | 0.68 | 23.0 | 0.46 | HIKKAKE SHORTLINE | -2.0 | Bearish | No | No | No | No | No | No | 48.0 | 55.0 | 8.0 | 66.0 | 53.0 | -33.0 | 49.0 | 24.0 | 12.0 | 22.0 | 18.0 |
| 36 | BLNK | 36.41 | 2730.0 | 3.56 | 99.0 | -1.54 | SHORTLINE | 1.0 | Bullish | No | No | No | No | No | No | 51.0 | 44.0 | -1.0 | 27.0 | 28.0 | -72.0 | 49.0 | 23.0 | 12.0 | 18.0 | 25.0 |
| 37 | BLUE | 28.28 | 2392.0 | -4.85 | 67.0 | -1.19 | EVENINGSTAR | -1.0 | Bearish | No | No | No | No | No | No | 54.0 | 42.0 | -12.0 | 17.0 | 32.0 | -82.0 | 46.0 | 23.0 | 16.0 | 23.0 | 31.0 |
| 38 | BMRN | 79.4 | 826.0 | 0.8 | 65.0 | 5.92 | 3OUTSIDE | 1.0 | Bullish | No | No | No | No | No | No | 55.0 | 57.0 | 0.0 | 92.0 | 84.0 | -7.0 | 53.0 | 23.0 | 20.0 | 20.0 | 24.0 |
| 39 | BNFT | 14.07 | 98.0 | -1.26 | 1.0 | 3.99 | BELTHOLD LONGLINE | -2.0 | Bearish | No | No | No | No | No | No | 67.0 | 47.0 | -3.0 | 55.0 | 63.0 | -44.0 | 49.0 | 22.0 | 9.0 | 16.0 | 19.0 |
| 40 | BNGO | 5.66 | 23011.0 | -7.36 | 130.0 | -26.68 | DOJI DOJISTAR HIGHWAVE LONGLEGGEDDOJI RICKSHAWMAN SPINNINGTOP | 6.0 | Bullish | No | No | No | No | No | No | 24.0 | 32.0 | -21.0 | 9.0 | 7.0 | -90.0 | 35.0 | 21.0 | 33.0 | 10.0 | 37.0 |
| 41 | BNR | 29.56 | 125.0 | -3.4 | 3.0 | 16.98 | HAMMER | 1.0 | Bullish | No | No | No | No | No | No | 65.0 | 52.0 | 1.0 | 74.0 | 85.0 | -25.0 | 56.0 | 23.0 | 19.0 | 23.0 | 22.0 |
| 42 | BOKF | 91.38 | 163.0 | 2.23 | 14.0 | 0.55 | BELTHOLD HIKKAKE LONGLINE | 4.0 | Bullish | No | No | No | No | No | No | 38.0 | 53.0 | 0.0 | 91.0 | 58.0 | -8.0 | 51.0 | 23.0 | 21.0 | 19.0 | 26.0 |
| 43 | BOMN | 26.38 | 193.0 | 4.43 | 5.0 | -19.45 | CLOSINGMARUBOZU LONGLINE | 2.0 | Bullish | No | No | No | No | No | No | 9.0 | 30.0 | -45.0 | 14.0 | 8.0 | -85.0 | 40.0 | 22.0 | 46.0 | 7.0 | 31.0 |
| 44 | BOOM | 56.03 | 87.0 | 2.02 | 4.0 | 4.38 | DOJI HARAMI HARAMICROSS HIGHWAVE HOMINGPIGEON LONGLEGGEDDOJI RICKSHAWMAN SPINNINGTOP | 4.0 | Bullish | No | No | No | No | No | No | 37.0 | 50.0 | -12.0 | 71.0 | 70.0 | -28.0 | 52.0 | 24.0 | 22.0 | 18.0 | 15.0 |
| 45 | BPMC | 95.2 | 224.0 | -0.78 | 21.0 | 2.07 | None | 0.0 | None | No | No | No | No | No | No | 51.0 | 47.0 | -6.0 | 57.0 | 65.0 | -42.0 | 47.0 | 23.0 | 18.0 | 17.0 | 27.0 |
| 46 | BPRN | 26.58 | 32.0 | -0.71 | 0.0 | -5.94 | None | 0.0 | None | No | No | No | No | No | No | 22.0 | 40.0 | -7.0 | 18.0 | 15.0 | -81.0 | 32.0 | 23.0 | 26.0 | 15.0 | 24.0 |
| 47 | BPY | 17.91 | 3729.0 | -0.28 | 66.0 | -0.78 | DOJI HIGHWAVE LONGLEGGEDDOJI RICKSHAWMAN SPINNINGTOP | 1.0 | Bullish | No | No | No | No | No | No | 57.0 | 54.0 | 9.0 | 61.0 | 55.0 | -38.0 | 57.0 | 23.0 | 11.0 | 14.0 | 13.0 |
| 48 | BPYPN | 23.94 | 7.0 | 1.23 | 0.0 | 0.08 | SHORTLINE | 1.0 | Bullish | No | No | No | No | No | No | 47.0 | 54.0 | 11.0 | 33.0 | 32.0 | -66.0 | 43.0 | 25.0 | 14.0 | 21.0 | 19.0 |
| 49 | BPYPO | 25.1 | 18.0 | 0.72 | 0.0 | -0.67 | SHOOTINGSTAR | -1.0 | Bearish | No | No | No | No | No | Yes | 38.0 | 55.0 | 10.0 | 27.0 | 18.0 | -72.0 | 38.0 | 26.0 | 16.0 | 17.0 | 15.0 |
| 50 | BPYPP | 25.22 | 4.0 | 0.04 | 0.0 | 0.08 | SHORTLINE | 1.0 | Bullish | No | No | No | No | No | No | 41.0 | 50.0 | 8.0 | 22.0 | 27.0 | -77.0 | 53.0 | 25.0 | 19.0 | 13.0 | 24.0 |
| 51 | BPYUP | 25.2 | 66.0 | 0.2 | 1.0 | 2.19 | None | 0.0 | None | No | No | No | No | No | No | 60.0 | 62.0 | 23.0 | 73.0 | 71.0 | -26.0 | 67.0 | 25.0 | 19.0 | 20.0 | 16.0 |
| 52 | BRID | 14.97 | 4.0 | 1.35 | 0.0 | -6.14 | DOJI HIGHWAVE LONGLEGGEDDOJI RICKSHAWMAN SPINNINGTOP | 5.0 | Bullish | No | No | No | No | No | No | 66.0 | 47.0 | -9.0 | 27.0 | 19.0 | -72.0 | 38.0 | 25.0 | 18.0 | 23.0 | 14.0 |
| 53 | BRKR | 67.65 | 610.0 | -0.32 | 41.0 | 6.97 | HAMMER HIKKAKE | 2.0 | Bullish | No | No | No | No | No | No | 68.0 | 61.0 | 27.0 | 61.0 | 67.0 | -38.0 | 49.0 | 24.0 | 32.0 | 25.0 | 13.0 |
| 54 | BRP | 30.69 | 492.0 | 3.89 | 15.0 | 15.2 | None | 0.0 | None | No | No | No | No | No | No | 74.0 | 72.0 | 24.0 | 82.0 | 88.0 | -17.0 | 65.0 | 23.0 | 29.0 | 32.0 | 8.0 |
| 55 | BRQS | 1.15 | 2154.0 | 2.68 | 2.0 | -17.27 | None | 0.0 | None | No | No | No | No | No | No | 30.0 | 38.0 | -16.0 | 18.0 | 12.0 | -81.0 | 45.0 | 21.0 | 13.0 | 18.0 | 27.0 |
| 56 | BSBK | 9.98 | 6.0 | 0.6 | 0.0 | -2.73 | SHORTLINE | -1.0 | Bearish | No | No | No | No | No | No | 26.0 | 48.0 | 0.0 | 57.0 | 53.0 | -42.0 | 44.0 | 23.0 | 29.0 | 18.0 | 30.0 |
| 57 | BSVN | 17.4 | 10.0 | 0.06 | 0.0 | 0.64 | HANGINGMAN | -1.0 | Bearish | No | No | No | No | No | No | 38.0 | 49.0 | -3.0 | 35.0 | 23.0 | -64.0 | 52.0 | 21.0 | 22.0 | 13.0 | 24.0 |
| 58 | BWAY | 9.05 | 15.0 | -4.84 | 0.0 | -1.09 | BELTHOLD CLOSINGMARUBOZU LONGLINE MARUBOZU | -4.0 | Bearish | No | No | No | No | No | No | 33.0 | 49.0 | 9.0 | 10.0 | 42.0 | -89.0 | 41.0 | 23.0 | 36.0 | 31.0 | 12.0 |
| 59 | BWMX | 39.79 | 30.0 | 0.71 | 1.0 | 3.51 | DOJI HARAMI HARAMICROSS LONGLEGGEDDOJI RICKSHAWMAN SPINNINGTOP | 6.0 | Bullish | No | No | No | No | No | No | 68.0 | 53.0 | 1.0 | 63.0 | 67.0 | -36.0 | 51.0 | 23.0 | 19.0 | 18.0 | 16.0 |
| 60 | BXRX | 1.07 | 1668.0 | 0.94 | 1.0 | -16.41 | None | 0.0 | None | No | No | No | No | No | No | 24.0 | 35.0 | -22.0 | 17.0 | 14.0 | -82.0 | 42.0 | 23.0 | 25.0 | 13.0 | 28.0 |
| 61 | BYFC | 2.05 | 159.0 | 0.0 | 0.0 | -17.34 | DOJI HIGHWAVE HIKKAKE LONGLEGGEDDOJI RICKSHAWMAN SPINNINGTOP | 6.0 | Bullish | No | No | No | No | No | No | 31.0 | 35.0 | -15.0 | 10.0 | 10.0 | -89.0 | 45.0 | 23.0 | 22.0 | 14.0 | 25.0 |
| 62 | BYND | 137.31 | 2371.0 | 0.12 | 325.0 | 8.87 | HIGHWAVE HIKKAKE SPINNINGTOP | -3.0 | Bearish | No | No | No | No | No | No | 57.0 | 51.0 | -8.0 | 80.0 | 75.0 | -19.0 | 53.0 | 22.0 | 12.0 | 25.0 | 18.0 |
| 63 | BYSI | 9.8 | 180.0 | -2.58 | 1.0 | -7.63 | BELTHOLD | -1.0 | Bearish | No | No | No | No | No | No | 37.0 | 32.0 | -28.0 | 12.0 | 18.0 | -87.0 | 43.0 | 23.0 | 26.0 | 13.0 | 26.0 |
| 64 | BZUN | 35.5 | 918.0 | 3.41 | 32.0 | -4.08 | HARAMI | 1.0 | Bullish | No | No | No | No | No | No | 53.0 | 40.0 | -24.0 | 31.0 | 24.0 | -68.0 | 41.0 | 22.0 | 33.0 | 14.0 | 27.0 |
| 65 | CAAS | 4.49 | 74.0 | 1.13 | 0.0 | -6.07 | HARAMI | 1.0 | Bullish | No | No | No | No | No | No | 31.0 | 38.0 | -18.0 | 18.0 | 14.0 | -81.0 | 49.0 | 23.0 | 14.0 | 16.0 | 26.0 |
| 66 | CABA | 10.7 | 68.0 | -0.47 | 0.0 | 1.61 | 3OUTSIDE DOJI DRAGONFLYDOJI LONGLEGGEDDOJI TAKURI | 3.0 | Bullish | No | No | No | No | No | No | 65.0 | 44.0 | -8.0 | 32.0 | 42.0 | -67.0 | 47.0 | 24.0 | 14.0 | 17.0 | 23.0 |
| 67 | CACC | 374.97 | 83.0 | 3.34 | 31.0 | -0.15 | None | 0.0 | None | No | No | No | No | No | No | 61.0 | 55.0 | -3.0 | 81.0 | 55.0 | -18.0 | 48.0 | 23.0 | 10.0 | 25.0 | 17.0 |
| 68 | CAKE | 57.84 | 361.0 | 0.26 | 20.0 | -3.0 | HARAMI HIKKAKE HOMINGPIGEON SHORTLINE SPINNINGTOP | 1.0 | Bullish | No | No | No | No | No | No | 19.0 | 50.0 | 5.0 | 13.0 | 24.0 | -86.0 | 39.0 | 23.0 | 16.0 | 14.0 | 14.0 |
| 69 | CALA | 2.15 | 577.0 | -2.27 | 1.0 | -11.89 | SHORTLINE SPINNINGTOP | -2.0 | Bearish | No | No | No | No | No | No | 35.0 | 25.0 | -40.0 | 14.0 | 21.0 | -85.0 | 41.0 | 23.0 | 50.0 | 6.0 | 31.0 |
| 70 | CALT | 26.88 | 14.0 | -1.14 | 0.0 | -2.11 | LONGLINE | -1.0 | Bearish | No | No | No | No | No | No | 47.0 | 40.0 | -17.0 | 11.0 | 12.0 | -88.0 | 47.0 | 22.0 | 26.0 | 15.0 | 30.0 |
| 71 | CAMT | 32.92 | 123.0 | 2.49 | 4.0 | 16.41 | HARAMI | 1.0 | Bullish | No | No | No | No | No | No | 64.0 | 58.0 | 20.0 | 69.0 | 68.0 | -30.0 | 49.0 | 24.0 | 27.0 | 28.0 | 17.0 |
| 72 | CAN | 13.61 | 12756.0 | 6.91 | 173.0 | -35.98 | BELTHOLD ENGULFING LONGLINE | 3.0 | Bullish | No | No | No | No | No | No | 55.0 | 39.0 | -14.0 | 12.0 | 10.0 | -87.0 | 39.0 | 22.0 | 20.0 | 16.0 | 29.0 |
| 73 | CARA | 28.51 | 623.0 | 0.71 | 17.0 | 38.47 | SHORTLINE | 1.0 | Bullish | No | No | No | No | No | No | 57.0 | 73.0 | 49.0 | 88.0 | 88.0 | -11.0 | 61.0 | 26.0 | 37.0 | 36.0 | 10.0 |
| 74 | CASI | 1.79 | 919.0 | -1.1 | 1.0 | -10.05 | 3OUTSIDE | -1.0 | Bearish | No | No | No | No | No | No | 48.0 | 32.0 | -26.0 | 9.0 | 7.0 | -90.0 | 44.0 | 23.0 | 27.0 | 13.0 | 31.0 |
| 75 | CATM | 38.8 | 202.0 | 0.08 | 7.0 | 0.05 | SHORTLINE | -1.0 | Bearish | No | No | No | No | No | No | 44.0 | 53.0 | 9.0 | 31.0 | 28.0 | -68.0 | 27.0 | 21.0 | 14.0 | 16.0 | 12.0 |
| 76 | CATY | 41.27 | 278.0 | 0.78 | 11.0 | -0.43 | HANGINGMAN | -1.0 | Bearish | No | No | No | No | No | No | 46.0 | 51.0 | 2.0 | 45.0 | 43.0 | -54.0 | 52.0 | 23.0 | 10.0 | 22.0 | 23.0 |
| 77 | CBAT | 4.46 | 1387.0 | 2.29 | 6.0 | -9.72 | None | 0.0 | None | No | No | No | No | No | No | 53.0 | 37.0 | -20.0 | 17.0 | 16.0 | -82.0 | 56.0 | 22.0 | 19.0 | 18.0 | 31.0 |
| 78 | CBAY | 4.32 | 1014.0 | 0.0 | 4.0 | -1.82 | HIGHWAVE SPINNINGTOP | 2.0 | Bullish | No | No | No | No | No | No | 41.0 | 40.0 | -20.0 | 34.0 | 30.0 | -65.0 | 37.0 | 22.0 | 28.0 | 13.0 | 23.0 |
| 79 | CBMB | 14.15 | 27.0 | -0.7 | 0.0 | 0.28 | CLOSINGMARUBOZU | -1.0 | Bearish | No | No | No | No | No | No | 75.0 | 49.0 | 1.0 | 53.0 | 79.0 | -46.0 | 41.0 | 19.0 | 15.0 | 23.0 | 30.0 |
| 80 | CBPO | 118.0 | 55.0 | -0.05 | 6.0 | -0.35 | 3OUTSIDE SPINNINGTOP | -2.0 | Bearish | No | No | No | No | No | No | 57.0 | 48.0 | 2.0 | 48.0 | 52.0 | -51.0 | 49.0 | 24.0 | 16.0 | 11.0 | 12.0 |
| 81 | CHMA | 2.92 | 1029.0 | 0.0 | 3.0 | -2.67 | SPINNINGTOP | -1.0 | Bearish | No | No | No | No | No | No | 48.0 | 38.0 | -24.0 | 31.0 | 31.0 | -68.0 | 43.0 | 22.0 | 24.0 | 15.0 | 25.0 |
| 82 | CHNG | 22.81 | 1284.0 | 0.8 | 29.0 | 2.42 | DOJI HIGHWAVE LONGLEGGEDDOJI RICKSHAWMAN SPINNINGTOP | 5.0 | Bullish | No | No | Yes | No | No | No | 69.0 | 56.0 | -3.0 | 95.0 | 88.0 | -4.0 | 59.0 | 24.0 | 24.0 | 19.0 | 15.0 |
| 83 | CHSCL | 28.65 | 33.0 | -0.59 | 0.0 | 0.1 | None | 0.0 | None | No | No | No | No | No | No | 49.0 | 46.0 | 2.0 | 25.0 | 51.0 | -74.0 | 51.0 | 23.0 | 11.0 | 11.0 | 15.0 |
| 84 | CHSCN | 27.85 | 14.0 | 0.0 | 0.0 | 1.05 | SPINNINGTOP | 1.0 | Bullish | No | No | No | No | No | No | 66.0 | 49.0 | 0.0 | 56.0 | 55.0 | -43.0 | 61.0 | 24.0 | 13.0 | 14.0 | 10.0 |
| 85 | CHSCO | 28.77 | 12.0 | 0.21 | 0.0 | -0.07 | None | 0.0 | None | No | No | No | No | No | No | 65.0 | 51.0 | 2.0 | 49.0 | 36.0 | -50.0 | 47.0 | 24.0 | 15.0 | 13.0 | 19.0 |
| 86 | CIGI | 105.33 | 261.0 | 2.11 | 27.0 | 5.49 | SHORTLINE | 1.0 | Bullish | No | No | No | No | No | No | 44.0 | 57.0 | 2.0 | 75.0 | 56.0 | -24.0 | 49.0 | 24.0 | 33.0 | 28.0 | 12.0 |
| 87 | CIZN | 21.4 | 29.0 | 10.31 | 0.0 | 9.63 | CLOSINGMARUBOZU | 1.0 | Bullish | No | No | No | No | No | No | 54.0 | 63.0 | -6.0 | 98.0 | 32.0 | -1.0 | 47.0 | 23.0 | 47.0 | 41.0 | 9.0 |
| 88 | CKPT | 2.85 | 647.0 | -4.21 | 1.0 | -7.03 | 3LINESTRIKE BELTHOLD ENGULFING EVENINGSTAR HIKKAKE LONGLINE | -2.0 | Bearish | No | No | No | No | No | No | 33.0 | 39.0 | -16.0 | 22.0 | 35.0 | -77.0 | 51.0 | 22.0 | 19.0 | 16.0 | 24.0 |
| 89 | CLBK | 18.05 | 131.0 | -0.11 | 2.0 | 2.32 | BELTHOLD | -1.0 | Bearish | No | No | No | No | No | No | 56.0 | 61.0 | 17.0 | 87.0 | 94.0 | -12.0 | 67.0 | 24.0 | 19.0 | 17.0 | 17.0 |
| 90 | CLDB | 22.76 | 0.0 | 0.26 | 0.0 | 1.16 | DOJI GRAVESTONEDOJI HIGHWAVE LONGLEGGEDDOJI SHOOTINGSTAR SPINNINGTOP | 4.0 | Bullish | No | No | No | No | No | No | 82.0 | 56.0 | 24.0 | 43.0 | 45.0 | -56.0 | 44.0 | 23.0 | 60.0 | 46.0 | 11.0 |
| 91 | CLEU | 3.52 | 542.0 | -0.85 | 1.0 | -3.83 | DOJI DOJISTAR HIGHWAVE LONGLEGGEDDOJI RICKSHAWMAN SPINNINGTOP | 2.0 | Bullish | No | No | No | No | No | No | 70.0 | 42.0 | -7.0 | 7.0 | 4.0 | -92.0 | 26.0 | 24.0 | 47.0 | 40.0 | 11.0 |
| 92 | CLLS | 19.4 | 249.0 | 0.52 | 4.0 | 3.14 | None | 0.0 | None | No | No | No | No | No | No | 73.0 | 45.0 | -9.0 | 33.0 | 38.0 | -66.0 | 47.0 | 22.0 | 17.0 | 18.0 | 24.0 |
| 93 | CLNE | 11.14 | 3052.0 | 0.18 | 33.0 | -15.67 | None | 0.0 | None | No | No | No | No | No | No | 28.0 | 39.0 | -12.0 | 8.0 | 14.0 | -91.0 | 38.0 | 23.0 | 21.0 | 17.0 | 35.0 |
| 94 | CLPT | 17.94 | 627.0 | -6.85 | 11.0 | -8.38 | 3OUTSIDE BELTHOLD LONGLINE | -3.0 | Bearish | No | No | No | No | No | No | 55.0 | 38.0 | -5.0 | 5.0 | 27.0 | -94.0 | 43.0 | 22.0 | 22.0 | 13.0 | 28.0 |
| 95 | CLUBQ | 0.27 | 71.0 | 0.0 | 0.0 | -10.0 | DOJI HIGHWAVE LONGLEGGEDDOJI RICKSHAWMAN SPINNINGTOP | 5.0 | Bullish | No | No | No | No | No | No | 38.0 | 41.0 | -12.0 | 22.0 | 34.0 | -77.0 | 54.0 | 22.0 | 40.0 | 9.0 | 22.0 |
| 96 | CMCO | 54.18 | 71.0 | 0.56 | 3.0 | 5.99 | SHORTLINE | -1.0 | Bearish | No | No | No | No | No | No | 66.0 | 58.0 | 11.0 | 65.0 | 62.0 | -34.0 | 46.0 | 24.0 | 31.0 | 24.0 | 15.0 |
| 97 | CME | 207.58 | 1220.0 | 1.73 | 253.0 | 1.29 | BELTHOLD | 1.0 | Bullish | No | No | No | No | No | No | 52.0 | 55.0 | 5.0 | 75.0 | 57.0 | -24.0 | 54.0 | 23.0 | 13.0 | 19.0 | 15.0 |
| 98 | CMPR | 101.85 | 80.0 | 1.86 | 8.0 | 2.4 | HARAMI SPINNINGTOP | 2.0 | Bullish | No | No | No | No | No | No | 54.0 | 48.0 | 6.0 | 35.0 | 45.0 | -64.0 | 40.0 | 24.0 | 14.0 | 13.0 | 21.0 |
| 99 | CMRX | 8.18 | 327.0 | -1.56 | 2.0 | -4.77 | None | 0.0 | None | No | No | No | No | No | No | 39.0 | 39.0 | -14.0 | 11.0 | 17.0 | -88.0 | 38.0 | 22.0 | 21.0 | 16.0 | 28.0 |
| 100 | CNBKA | 115.0 | 8.0 | 0.44 | 0.0 | 21.63 | HARAMI HOMINGPIGEON | 2.0 | Bullish | No | No | No | No | No | No | 91.0 | 71.0 | 34.0 | 80.0 | 86.0 | -19.0 | 69.0 | 24.0 | 33.0 | 47.0 | 12.0 |
| 101 | CNCE | 4.41 | 309.0 | -4.55 | 1.0 | -9.26 | BELTHOLD LONGLINE | -2.0 | Bearish | No | No | No | No | No | No | 57.0 | 27.0 | -42.0 | 7.0 | 17.0 | -92.0 | 37.0 | 23.0 | 47.0 | 13.0 | 31.0 |
| 102 | CNFR | 3.61 | 9.0 | 1.69 | 0.0 | -5.0 | BELTHOLD | -1.0 | Bearish | No | No | No | No | No | No | 50.0 | 42.0 | -3.0 | 25.0 | 26.0 | -74.0 | 44.0 | 23.0 | 17.0 | 17.0 | 23.0 |
| 103 | CNTG | 11.51 | 57.0 | -1.37 | 0.0 | -0.95 | BELTHOLD CLOSINGMARUBOZU LONGLINE MARUBOZU | -4.0 | Bearish | Yes | No | No | No | No | Yes | 56.0 | 44.0 | -2.0 | 13.0 | 27.0 | -86.0 | 41.0 | 24.0 | 13.0 | 16.0 | 19.0 |
| 104 | COHU | 48.66 | 418.0 | 1.76 | 20.0 | 21.65 | None | 0.0 | None | No | No | No | No | No | No | 61.0 | 58.0 | 16.0 | 82.0 | 80.0 | -17.0 | 61.0 | 23.0 | 19.0 | 25.0 | 19.0 |
| 105 | FBRX | 36.8 | 170.0 | 0.05 | 6.0 | 14.36 | DOJI DRAGONFLYDOJI HANGINGMAN HIKKAKE LONGLEGGEDDOJI TAKURI | 4.0 | Bullish | No | No | No | No | No | No | 60.0 | 59.0 | 16.0 | 68.0 | 71.0 | -31.0 | 63.0 | 25.0 | 14.0 | 26.0 | 22.0 |
| 106 | FCBP | 24.45 | 21.0 | -0.41 | 0.0 | -0.81 | None | 0.0 | None | No | No | No | No | No | No | 42.0 | 57.0 | 17.0 | 44.0 | 46.0 | -55.0 | 49.0 | 21.0 | 48.0 | 24.0 | 12.0 |
| 107 | FCCO | 19.55 | 22.0 | 2.14 | 0.0 | -6.41 | SPINNINGTOP | 1.0 | Bullish | No | No | No | No | No | No | 40.0 | 51.0 | -2.0 | 34.0 | 21.0 | -65.0 | 47.0 | 24.0 | 21.0 | 15.0 | 16.0 |
| 108 | FCNCA | 857.0 | 46.0 | 0.74 | 39.0 | 0.48 | DOJI DOJISTAR DRAGONFLYDOJI HANGINGMAN LONGLEGGEDDOJI RICKSHAWMAN SHORTLINE SPINNINGTOP TAKURI | 1.0 | Bullish | No | No | No | No | No | No | 69.0 | 59.0 | 14.0 | 84.0 | 76.0 | -15.0 | 57.0 | 24.0 | 16.0 | 25.0 | 21.0 |
| 109 | FCNCP | 26.85 | 26.0 | -0.78 | 0.0 | -0.15 | BELTHOLD CLOSINGMARUBOZU LONGLINE MARUBOZU RISEFALL3METHODS | -5.0 | Bearish | No | No | No | No | No | No | 66.0 | 47.0 | 10.0 | 34.0 | 66.0 | -65.0 | 51.0 | 22.0 | 13.0 | 14.0 | 23.0 |
| 110 | FDUS | 16.66 | 74.0 | 0.18 | 1.0 | 6.32 | DOJI LONGLEGGEDDOJI RICKSHAWMAN SPINNINGTOP | 4.0 | Bullish | No | No | No | No | No | No | 77.0 | 64.0 | 35.0 | 73.0 | 76.0 | -26.0 | 51.0 | 24.0 | 31.0 | 26.0 | 14.0 |
| 111 | FEIM | 10.75 | 18.0 | -4.87 | 0.0 | -7.33 | BELTHOLD | -1.0 | Bearish | No | No | No | No | No | No | 29.0 | 34.0 | -8.0 | 8.0 | 17.0 | -91.0 | 30.0 | 24.0 | 11.0 | 15.0 | 25.0 |
| 112 | FELE | 81.42 | 162.0 | 0.54 | 13.0 | 3.19 | HIGHWAVE SPINNINGTOP | -2.0 | Bearish | No | No | No | No | No | No | 63.0 | 59.0 | 14.0 | 74.0 | 68.0 | -25.0 | 61.0 | 23.0 | 17.0 | 27.0 | 16.0 |
| 113 | FFBC | 24.53 | 193.0 | 0.29 | 4.0 | 0.74 | None | 0.0 | None | No | No | No | No | No | No | 41.0 | 54.0 | 7.0 | 58.0 | 60.0 | -41.0 | 56.0 | 24.0 | 14.0 | 25.0 | 22.0 |
| 114 | FFBW | 11.15 | 0.0 | -0.18 | 0.0 | -0.89 | BELTHOLD CLOSINGMARUBOZU LONGLINE MARUBOZU | -4.0 | Bearish | No | No | No | No | No | No | 67.0 | 49.0 | 10.0 | 21.0 | 28.0 | -78.0 | 38.0 | 21.0 | 24.0 | 23.0 | 24.0 |
| 115 | FFNW | 13.72 | 10.0 | -0.51 | 0.0 | -3.79 | DOJI GRAVESTONEDOJI LONGLEGGEDDOJI | 3.0 | Bullish | No | No | No | No | No | No | 15.0 | 45.0 | 0.0 | 1.0 | 3.0 | -98.0 | 25.0 | 24.0 | 25.0 | 20.0 | 17.0 |
| 116 | FFWM | 23.69 | 94.0 | 0.68 | 2.0 | 0.59 | HANGINGMAN | -1.0 | Bearish | No | No | No | No | No | No | 51.0 | 54.0 | 0.0 | 74.0 | 67.0 | -25.0 | 54.0 | 24.0 | 9.0 | 16.0 | 15.0 |
| 117 | FGEN | 19.91 | 3857.0 | 3.16 | 76.0 | -36.0 | None | 0.0 | None | No | No | No | No | No | No | 28.0 | 26.0 | -46.0 | 9.0 | 7.0 | -90.0 | 45.0 | 23.0 | 41.0 | 13.0 | 44.0 |
| 118 | FISV | 125.09 | 3707.0 | -0.35 | 463.0 | 3.59 | HARAMI | -1.0 | Bearish | No | No | No | No | No | No | 57.0 | 61.0 | 20.0 | 84.0 | 85.0 | -15.0 | 59.0 | 22.0 | 16.0 | 21.0 | 13.0 |
| 119 | FITB | 38.2 | 5000.0 | 0.45 | 191.0 | 0.21 | DOJI HARAMI HARAMICROSS HIGHWAVE HOMINGPIGEON LONGLEGGEDDOJI RICKSHAWMAN SPINNINGTOP | 4.0 | Bullish | No | No | No | No | No | No | 45.0 | 54.0 | 12.0 | 63.0 | 67.0 | -36.0 | 51.0 | 23.0 | 16.0 | 25.0 | 23.0 |
| 120 | FIVN | 177.43 | 297.0 | -0.74 | 52.0 | 17.16 | None | 0.0 | None | No | No | No | No | No | No | 73.0 | 57.0 | 8.0 | 86.0 | 84.0 | -13.0 | 65.0 | 22.0 | 16.0 | 23.0 | 17.0 |
| 121 | FIZZ | 51.88 | 1025.0 | 2.01 | 53.0 | 7.52 | None | 0.0 | None | No | No | No | No | No | No | 77.0 | 56.0 | -2.0 | 69.0 | 73.0 | -30.0 | 43.0 | 22.0 | 11.0 | 23.0 | 13.0 |
| 122 | FLIR | 58.53 | 2030.0 | 0.19 | 118.0 | 4.44 | DOJI DOJISTAR HIGHWAVE LONGLEGGEDDOJI RICKSHAWMAN SPINNINGTOP | 4.0 | Bullish | No | No | No | No | No | No | 85.0 | 71.0 | 36.0 | 96.0 | 94.0 | -3.0 | 68.0 | 23.0 | 29.0 | 26.0 | 10.0 |
| 123 | FLL | 8.8 | 150.0 | 0.0 | 1.0 | 1.73 | SPINNINGTOP | -1.0 | Bearish | No | No | No | No | No | No | 66.0 | 55.0 | 16.0 | 45.0 | 53.0 | -54.0 | 48.0 | 24.0 | 27.0 | 25.0 | 15.0 |
| 124 | FLMN | 4.48 | 221.0 | 0.0 | 0.0 | 0.22 | HIGHWAVE MATCHINGLOW SPINNINGTOP | -1.0 | Bearish | No | No | No | No | No | No | 45.0 | 50.0 | 5.0 | 32.0 | 45.0 | -67.0 | 51.0 | 23.0 | 15.0 | 18.0 | 17.0 |
| 125 | FLWS | 26.24 | 352.0 | 1.94 | 9.0 | 1.0 | LONGLINE | 1.0 | Bullish | No | No | No | No | No | No | 34.0 | 43.0 | -15.0 | 33.0 | 26.0 | -66.0 | 48.0 | 23.0 | 22.0 | 16.0 | 26.0 |
| 126 | FLXN | 9.41 | 545.0 | -2.69 | 5.0 | 9.29 | BELTHOLD | -1.0 | Bearish | No | No | No | No | No | No | 60.0 | 48.0 | -19.0 | 82.0 | 83.0 | -17.0 | 56.0 | 25.0 | 29.0 | 18.0 | 21.0 |
| 127 | FMAO | 24.1 | 5.0 | -1.07 | 0.0 | -4.25 | BELTHOLD CLOSINGMARUBOZU LONGLINE MARUBOZU | -4.0 | Bearish | No | No | No | No | No | No | 5.0 | 41.0 | -6.0 | 1.0 | 7.0 | -98.0 | 35.0 | 22.0 | 17.0 | 14.0 | 27.0 |
| 128 | FMBI | 21.96 | 439.0 | 1.1 | 9.0 | -1.39 | BELTHOLD LONGLINE | -2.0 | Bearish | No | No | No | No | No | No | 41.0 | 53.0 | 5.0 | 59.0 | 51.0 | -40.0 | 52.0 | 24.0 | 17.0 | 20.0 | 26.0 |
| 129 | FMBIP | 27.9 | 12.0 | 0.18 | 0.0 | 1.45 | None | 0.0 | None | No | No | No | No | No | No | 53.0 | 56.0 | 7.0 | 76.0 | 72.0 | -23.0 | 54.0 | 24.0 | 9.0 | 19.0 | 13.0 |
| 130 | FMNB | 16.66 | 42.0 | -0.89 | 0.0 | 1.22 | BELTHOLD LONGLINE | -2.0 | Bearish | No | No | No | No | No | No | 61.0 | 56.0 | 19.0 | 47.0 | 58.0 | -52.0 | 40.0 | 23.0 | 47.0 | 28.0 | 10.0 |
| 131 | FNCB | 7.0 | 27.0 | -0.28 | 0.0 | -11.62 | ENGULFING SHORTLINE | -2.0 | Bearish | No | No | No | No | No | No | 32.0 | 39.0 | -13.0 | 0.0 | 2.0 | -99.0 | 24.0 | 23.0 | 22.0 | 15.0 | 14.0 |
| 132 | FNLC | 28.94 | 28.0 | -0.45 | 0.0 | -1.5 | None | 0.0 | None | No | No | No | No | No | Yes | 48.0 | 52.0 | 6.0 | 46.0 | 46.0 | -53.0 | 46.0 | 23.0 | 30.0 | 23.0 | 13.0 |
| 133 | FNWB | 16.75 | 19.0 | -0.36 | 0.0 | 1.15 | BELTHOLD CLOSINGMARUBOZU HIKKAKE LONGLINE MARUBOZU | -6.0 | Bearish | No | No | No | No | No | No | 59.0 | 46.0 | -4.0 | 31.0 | 33.0 | -68.0 | 21.0 | 23.0 | 34.0 | 20.0 | 10.0 |
| 134 | FOLD | 9.94 | 2150.0 | -3.78 | 21.0 | 5.86 | BELTHOLD ENGULFING LONGLINE | -3.0 | Bearish | No | No | No | No | No | No | 53.0 | 44.0 | -25.0 | 68.0 | 76.0 | -31.0 | 52.0 | 23.0 | 43.0 | 20.0 | 24.0 |
| 135 | FORR | 43.28 | 29.0 | 0.65 | 1.0 | 2.15 | HANGINGMAN | -1.0 | Bearish | No | No | No | No | No | No | 41.0 | 52.0 | -10.0 | 70.0 | 55.0 | -29.0 | 56.0 | 24.0 | 11.0 | 19.0 | 16.0 |
| 136 | FORTY | 91.3 | 5.0 | -0.11 | 0.0 | 6.16 | SHORTLINE | -1.0 | Bearish | No | No | No | No | No | No | 44.0 | 51.0 | 5.0 | 54.0 | 48.0 | -45.0 | 48.0 | 25.0 | 15.0 | 17.0 | 10.0 |
| 137 | FOX | 36.72 | 870.0 | -0.14 | 31.0 | 2.46 | SPINNINGTOP | -1.0 | Bearish | No | No | No | No | No | No | 36.0 | 52.0 | 0.0 | 81.0 | 62.0 | -18.0 | 45.0 | 23.0 | 22.0 | 19.0 | 19.0 |
| 138 | FOXF | 141.22 | 144.0 | 1.39 | 20.0 | 10.82 | SHORTLINE SPINNINGTOP | 2.0 | Bullish | No | No | No | No | No | No | 78.0 | 62.0 | 9.0 | 94.0 | 93.0 | -5.0 | 72.0 | 23.0 | 10.0 | 25.0 | 17.0 |
| 139 | FRG | 37.37 | 168.0 | 1.41 | 6.0 | 5.98 | None | 0.0 | None | No | No | No | No | No | No | 59.0 | 53.0 | 1.0 | 76.0 | 72.0 | -23.0 | 60.0 | 23.0 | 17.0 | 16.0 | 20.0 |
| 140 | FRLN | 12.42 | 3.0 | 2.31 | 0.0 | -6.55 | SHORTLINE SPINNINGTOP | -2.0 | Bearish | No | No | No | No | No | No | 28.0 | 41.0 | -17.0 | 27.0 | 16.0 | -72.0 | 33.0 | 25.0 | 36.0 | 7.0 | 18.0 |
| 141 | FRME | 46.78 | 84.0 | 0.47 | 3.0 | -1.18 | SHORTLINE | -1.0 | Bearish | No | No | No | No | No | No | 50.0 | 52.0 | 4.0 | 45.0 | 47.0 | -54.0 | 44.0 | 24.0 | 23.0 | 22.0 | 12.0 |
| 142 | FRPH | 51.02 | 7.0 | 0.02 | 0.0 | 4.81 | None | 0.0 | None | No | No | No | No | No | No | 62.0 | 61.0 | 9.0 | 86.0 | 87.0 | -13.0 | 46.0 | 24.0 | 19.0 | 27.0 | 15.0 |
| 143 | FRSX | 4.69 | 1907.0 | -1.05 | 8.0 | -19.28 | 3OUTSIDE | -1.0 | Bearish | No | No | No | No | No | No | 42.0 | 34.0 | -21.0 | 18.0 | 16.0 | -81.0 | 46.0 | 21.0 | 26.0 | 14.0 | 32.0 |
| 144 | FRTA | 23.4 | 252.0 | -0.13 | 5.0 | 0.52 | 3OUTSIDE SHORTLINE | -2.0 | Bearish | No | No | No | No | No | No | 54.0 | 57.0 | 23.0 | 42.0 | 52.0 | -57.0 | 44.0 | 20.0 | 28.0 | 20.0 | 14.0 |
| 145 | FSEA | 9.89 | 2.0 | 5.84 | 0.0 | 0.1 | BELTHOLD CLOSINGMARUBOZU HIKKAKE LONGLINE MARUBOZU | 6.0 | Bullish | No | No | No | No | No | No | 72.0 | 53.0 | 1.0 | 88.0 | 68.0 | -11.0 | 49.0 | 28.0 | 38.0 | 10.0 | 37.0 |
| 146 | FSFG | 69.51 | 4.0 | 1.47 | 0.0 | 3.16 | DOJI HIGHWAVE LONGLEGGEDDOJI RICKSHAWMAN SHORTLINE SPINNINGTOP | 6.0 | Bullish | No | No | No | No | No | No | 73.0 | 56.0 | 9.0 | 71.0 | 67.0 | -28.0 | 53.0 | 27.0 | 18.0 | 20.0 | 17.0 |
| 147 | FSLR | 80.14 | 5453.0 | 3.85 | 437.0 | -7.38 | BELTHOLD CLOSINGMARUBOZU LONGLINE MARUBOZU | 4.0 | Bullish | No | No | No | No | No | No | 49.0 | 46.0 | -10.0 | 32.0 | 22.0 | -67.0 | 48.0 | 23.0 | 22.0 | 17.0 | 28.0 |
| 148 | FTDR | 56.75 | 200.0 | 2.49 | 11.0 | 4.61 | None | 0.0 | None | No | No | No | No | No | No | 63.0 | 59.0 | 4.0 | 95.0 | 90.0 | -4.0 | 71.0 | 24.0 | 10.0 | 16.0 | 13.0 |
| 149 | FTEK | 2.36 | 585.0 | 1.29 | 1.0 | -22.11 | THRUSTING | -1.0 | Bearish | No | No | No | No | No | No | 22.0 | 28.0 | -34.0 | 13.0 | 8.0 | -86.0 | 34.0 | 22.0 | 32.0 | 12.0 | 35.0 |
| 150 | FTFT | 3.75 | 5006.0 | -1.57 | 18.0 | -40.48 | None | 0.0 | None | No | No | No | No | No | No | 71.0 | 31.0 | -18.0 | 11.0 | 5.0 | -88.0 | 32.0 | 23.0 | 17.0 | 22.0 | 30.0 |
| 151 | FTHM | 32.37 | 51.0 | 2.02 | 1.0 | -9.66 | DOJI HIGHWAVE LONGLEGGEDDOJI RICKSHAWMAN SPINNINGTOP | 5.0 | Bullish | No | No | No | No | No | No | 21.0 | 38.0 | -19.0 | 18.0 | 9.0 | -81.0 | 37.0 | 23.0 | 26.0 | 12.0 | 25.0 |
| 152 | FULC | 11.53 | 28.0 | -3.27 | 0.0 | 0.87 | None | 0.0 | None | No | No | No | No | No | No | 36.0 | 45.0 | -6.0 | 51.0 | 65.0 | -48.0 | 54.0 | 22.0 | 10.0 | 16.0 | 19.0 |
| 153 | FUSB | 10.06 | 3.0 | -0.4 | 0.0 | 2.76 | SHORTLINE | -1.0 | Bearish | No | No | No | No | No | No | 77.0 | 63.0 | 18.0 | 66.0 | 64.0 | -33.0 | 47.0 | 24.0 | 47.0 | 41.0 | 6.0 |
| 154 | FUSN | 8.44 | 22.0 | -3.1 | 0.0 | -15.01 | None | 0.0 | None | No | No | No | No | No | No | 17.0 | 29.0 | -31.0 | 5.0 | 11.0 | -94.0 | 32.0 | 26.0 | 27.0 | 9.0 | 28.0 |
| 155 | FUTU | 153.01 | 3712.0 | 3.39 | 567.0 | 10.99 | LONGLINE | 1.0 | Bullish | No | No | No | No | No | No | 71.0 | 54.0 | 6.0 | 76.0 | 77.0 | -23.0 | 58.0 | 23.0 | 17.0 | 22.0 | 16.0 |
| 156 | FUV | 11.45 | 896.0 | 2.88 | 10.0 | -13.19 | None | 0.0 | None | No | No | No | No | No | No | 43.0 | 36.0 | -28.0 | 17.0 | 16.0 | -82.0 | 46.0 | 21.0 | 26.0 | 13.0 | 26.0 |
| 157 | GAINL | 25.49 | 1.0 | -0.55 | 0.0 | 0.31 | BELTHOLD LONGLINE | -2.0 | Bearish | No | No | No | No | No | No | 41.0 | 51.0 | 3.0 | 42.0 | 62.0 | -57.0 | 43.0 | 24.0 | 26.0 | 24.0 | 7.0 |
| 158 | GAN | 18.35 | 1240.0 | 2.17 | 22.0 | 4.08 | HAMMER | 1.0 | Bullish | No | No | No | No | No | No | 40.0 | 34.0 | -29.0 | 26.0 | 21.0 | -73.0 | 38.0 | 23.0 | 28.0 | 13.0 | 31.0 |
| 159 | GBDC | 15.38 | 260.0 | 0.13 | 3.0 | 3.71 | DOJI LONGLEGGEDDOJI RICKSHAWMAN SPINNINGTOP | 2.0 | Bullish | No | No | No | No | No | No | 48.0 | 60.0 | 15.0 | 89.0 | 83.0 | -10.0 | 52.0 | 24.0 | 10.0 | 19.0 | 14.0 |
| 160 | GBIO | 28.3 | 479.0 | 2.83 | 13.0 | 6.43 | SPINNINGTOP | 1.0 | Bullish | No | No | No | No | No | No | 35.0 | 45.0 | -17.0 | 57.0 | 45.0 | -42.0 | 49.0 | 22.0 | 18.0 | 17.0 | 24.0 |
| 161 | GCBC | 25.1 | 7.0 | -2.98 | 0.0 | 1.91 | CLOSINGMARUBOZU ENGULFING | -2.0 | Bearish | No | No | No | No | No | No | 54.0 | 48.0 | -2.0 | 30.0 | 57.0 | -69.0 | 28.0 | 23.0 | 19.0 | 29.0 | 11.0 |
| 162 | GDYN | 14.56 | 56.0 | 0.21 | 0.0 | -8.43 | HANGINGMAN | -1.0 | Bearish | No | No | No | No | No | No | 39.0 | 43.0 | -9.0 | 21.0 | 19.0 | -78.0 | 54.0 | 23.0 | 17.0 | 12.0 | 19.0 |
| 163 | GENC | 12.58 | 24.0 | -1.95 | 0.0 | -4.26 | BELTHOLD CLOSINGMARUBOZU ENGULFING LONGLINE MARUBOZU | -5.0 | Bearish | No | No | No | No | No | No | 54.0 | 38.0 | -19.0 | 12.0 | 20.0 | -87.0 | 39.0 | 23.0 | 26.0 | 14.0 | 24.0 |
| 164 | GFED | 25.49 | 12.0 | -2.9 | 0.0 | 33.88 | HIKKAKE SPINNINGTOP TASUKIGAP | -1.0 | Bearish | No | No | No | No | No | No | 86.0 | 80.0 | 55.0 | 81.0 | 86.0 | -18.0 | 60.0 | 27.0 | 53.0 | 50.0 | 3.0 |
| 165 | GFNCP | 103.0 | 11.0 | -2.14 | 1.0 | -0.48 | BELTHOLD | -1.0 | Bearish | No | No | No | No | No | No | 21.0 | 46.0 | 16.0 | 20.0 | 60.0 | -79.0 | 48.0 | 24.0 | 16.0 | 27.0 | 41.0 |
| 166 | GH | 158.5 | 454.0 | -0.44 | 71.0 | 7.98 | None | 0.0 | None | No | No | No | No | No | No | 70.0 | 57.0 | 12.0 | 80.0 | 79.0 | -19.0 | 55.0 | 23.0 | 15.0 | 24.0 | 20.0 |
| 167 | GIII | 31.96 | 317.0 | 2.01 | 10.0 | 6.82 | None | 0.0 | None | No | No | No | No | No | No | 44.0 | 56.0 | 3.0 | 95.0 | 77.0 | -4.0 | 62.0 | 24.0 | 19.0 | 19.0 | 23.0 |
| 168 | GILD | 66.87 | 7124.0 | 1.67 | 476.0 | 2.09 | LONGLINE | 1.0 | Bullish | Yes | No | No | No | No | No | 53.0 | 60.0 | 8.0 | 92.0 | 69.0 | -7.0 | 55.0 | 23.0 | 18.0 | 24.0 | 14.0 |
| 169 | GLAD | 10.76 | 162.0 | 0.84 | 1.0 | 8.03 | HANGINGMAN | -1.0 | Bearish | No | No | No | No | No | No | 84.0 | 72.0 | 34.0 | 98.0 | 92.0 | -1.0 | 63.0 | 23.0 | 21.0 | 26.0 | 15.0 |
| 170 | GLBZ | 12.0 | 20.0 | 0.0 | 0.0 | -0.74 | None | 0.0 | None | No | No | No | No | No | No | 12.0 | 52.0 | 3.0 | 61.0 | 68.0 | -38.0 | 48.0 | 25.0 | 19.0 | 25.0 | 36.0 |
| 171 | GLMD | 3.07 | 278.0 | -3.46 | 0.0 | -7.81 | 3OUTSIDE HIKKAKE LONGLINE | -1.0 | Bearish | No | No | No | No | No | No | 26.0 | 35.0 | -19.0 | 7.0 | 21.0 | -92.0 | 38.0 | 22.0 | 12.0 | 15.0 | 23.0 |
| 172 | GLNG | 10.49 | 1683.0 | 3.45 | 17.0 | 3.66 | HIKKAKE | -1.0 | Bearish | No | No | No | No | No | No | 42.0 | 47.0 | -11.0 | 71.0 | 53.0 | -28.0 | 46.0 | 23.0 | 11.0 | 25.0 | 26.0 |
| 173 | GLYC | 2.61 | 543.0 | 2.35 | 1.0 | -10.0 | None | 0.0 | None | No | No | No | No | No | No | 32.0 | 36.0 | -24.0 | 18.0 | 17.0 | -81.0 | 39.0 | 24.0 | 23.0 | 15.0 | 29.0 |
| 174 | GMDA | 7.65 | 269.0 | -2.17 | 2.0 | -2.55 | BELTHOLD HIKKAKE LONGLINE | -1.0 | Bearish | No | No | No | No | No | No | 41.0 | 39.0 | -17.0 | 15.0 | 35.0 | -84.0 | 44.0 | 22.0 | 17.0 | 15.0 | 22.0 |
| 175 | GNTX | 36.03 | 1440.0 | 0.5 | 51.0 | 0.39 | DOJI HIGHWAVE HIKKAKE LONGLEGGEDDOJI RICKSHAWMAN SPINNINGTOP | 3.0 | Bullish | No | No | No | No | No | No | 59.0 | 53.0 | 1.0 | 59.0 | 61.0 | -40.0 | 53.0 | 23.0 | 8.0 | 25.0 | 19.0 |
| 176 | HTHT | 57.31 | 860.0 | 2.98 | 49.0 | 4.16 | BELTHOLD LONGLINE | 2.0 | Bullish | No | No | No | No | No | No | 62.0 | 54.0 | 0.0 | 96.0 | 82.0 | -3.0 | 57.0 | 24.0 | 12.0 | 26.0 | 20.0 |
| 177 | HTLF | 50.34 | 115.0 | 0.94 | 5.0 | -0.75 | DOJI HIGHWAVE LONGLEGGEDDOJI RICKSHAWMAN SPINNINGTOP | 1.0 | Bullish | No | No | No | No | No | No | 49.0 | 52.0 | 4.0 | 63.0 | 57.0 | -36.0 | 57.0 | 24.0 | 16.0 | 14.0 | 17.0 |
| 178 | HUIZ | 7.41 | 213.0 | -1.98 | 1.0 | -10.83 | 3OUTSIDE | -1.0 | Bearish | No | No | No | No | No | No | 20.0 | 37.0 | -13.0 | 15.0 | 10.0 | -84.0 | 36.0 | 23.0 | 15.0 | 16.0 | 29.0 |
| 179 | HURC | 35.2 | 16.0 | 0.98 | 0.0 | 0.34 | BELTHOLD LONGLINE | 2.0 | Bullish | No | No | No | No | No | No | 68.0 | 56.0 | 7.0 | 64.0 | 59.0 | -35.0 | 42.0 | 24.0 | 13.0 | 23.0 | 19.0 |
| 180 | HURN | 55.77 | 75.0 | -0.52 | 4.0 | 12.64 | None | 0.0 | None | No | No | No | No | No | No | 76.0 | 60.0 | 8.0 | 83.0 | 91.0 | -16.0 | 54.0 | 22.0 | 17.0 | 28.0 | 17.0 |
| 181 | HWC | 43.41 | 243.0 | 0.98 | 10.0 | 3.23 | SPINNINGTOP | -1.0 | Bearish | No | No | Yes | No | No | No | 48.0 | 58.0 | 8.0 | 87.0 | 81.0 | -12.0 | 65.0 | 24.0 | 13.0 | 30.0 | 20.0 |
| 182 | HYACU | 10.1 | 8.0 | 0.0 | 0.0 | 1.81 | DOJI DRAGONFLYDOJI LONGLEGGEDDOJI TAKURI | 4.0 | Bullish | No | No | No | No | No | No | 86.0 | 62.0 | 35.0 | 78.0 | 81.0 | -21.0 | 72.0 | 17.0 | 18.0 | 28.0 | 11.0 |
| 183 | HYMC | 4.0 | 113.0 | 0.0 | 0.0 | 13.64 | HANGINGMAN | -1.0 | Bearish | No | No | No | No | No | No | 34.0 | 35.0 | -37.0 | 63.0 | 47.0 | -36.0 | 55.0 | 24.0 | 36.0 | 15.0 | 36.0 |
| 184 | HYRE | 11.86 | 674.0 | 0.94 | 7.0 | 32.96 | None | 0.0 | None | No | No | No | No | No | No | 63.0 | 61.0 | 16.0 | 86.0 | 83.0 | -13.0 | 71.0 | 23.0 | 17.0 | 19.0 | 15.0 |
| 185 | IBEX | 24.95 | 36.0 | 5.05 | 0.0 | 19.15 | HANGINGMAN | -1.0 | Bearish | No | No | No | No | No | No | 81.0 | 62.0 | 11.0 | 98.0 | 78.0 | -1.0 | 73.0 | 25.0 | 22.0 | 26.0 | 13.0 |
| 186 | IBOC | 47.25 | 143.0 | 1.68 | 6.0 | -0.44 | HANGINGMAN HIKKAKE | -2.0 | Bearish | No | No | No | No | No | No | 32.0 | 53.0 | 0.0 | 60.0 | 49.0 | -39.0 | 62.0 | 23.0 | 10.0 | 20.0 | 21.0 |
| 187 | ICBK | 24.01 | 6.0 | 0.04 | 0.0 | 1.48 | CLOSINGMARUBOZU LONGLINE MATCHINGLOW | -1.0 | Bearish | No | No | No | No | No | No | 59.0 | 51.0 | -1.0 | 54.0 | 63.0 | -45.0 | 39.0 | 22.0 | 16.0 | 19.0 | 19.0 |
| 188 | ICCH | 15.0 | 0.0 | 5.19 | 0.0 | 0.94 | DOJI HIGHWAVE LONGLEGGEDDOJI RICKSHAWMAN SPINNINGTOP | 5.0 | Bullish | No | No | No | No | No | No | 41.0 | 53.0 | 9.0 | 15.0 | 5.0 | -84.0 | 36.0 | 28.0 | 32.0 | 52.0 | 15.0 |
| 189 | IDYA | 18.61 | 583.0 | -0.48 | 10.0 | -18.73 | DOJI HIGHWAVE LONGLEGGEDDOJI SPINNINGTOP | 4.0 | Bullish | No | No | No | No | No | No | 32.0 | 39.0 | -11.0 | 16.0 | 17.0 | -83.0 | 42.0 | 24.0 | 23.0 | 14.0 | 30.0 |
| 190 | IESC | 50.44 | 73.0 | 1.9 | 3.0 | 1.22 | HANGINGMAN | -1.0 | Bearish | No | No | No | No | No | No | 62.0 | 50.0 | 6.0 | 38.0 | 39.0 | -61.0 | 46.0 | 24.0 | 16.0 | 22.0 | 29.0 |
| 191 | IFRX | 3.7 | 152.0 | 0.0 | 0.0 | -2.37 | DOJI LONGLEGGEDDOJI RICKSHAWMAN SHORTLINE SPINNINGTOP | 5.0 | Bullish | No | No | No | No | No | No | 28.0 | 39.0 | -21.0 | 26.0 | 29.0 | -73.0 | 51.0 | 23.0 | 33.0 | 13.0 | 29.0 |
| 192 | IGIC | 7.0 | 63.0 | -1.27 | 0.0 | -14.63 | DOJI HIGHWAVE HIKKAKE LONGLEGGEDDOJI RICKSHAWMAN SPINNINGTOP | 2.0 | Bullish | No | No | No | No | No | No | 81.0 | 39.0 | -15.0 | 5.0 | 7.0 | -94.0 | 56.0 | 27.0 | 29.0 | 33.0 | 16.0 |
| 193 | IIN | 25.39 | 28.0 | 0.75 | 0.0 | -6.38 | DOJI HIGHWAVE LONGLEGGEDDOJI RICKSHAWMAN SPINNINGTOP | 1.0 | Bullish | No | No | Yes | No | No | No | 47.0 | 54.0 | 4.0 | 38.0 | 40.0 | -61.0 | 40.0 | 25.0 | 22.0 | 25.0 | 15.0 |
| 194 | IIVI | 81.42 | 1475.0 | -0.31 | 120.0 | 22.29 | SHORTLINE | -1.0 | Bearish | No | No | No | No | No | No | 69.0 | 61.0 | 9.0 | 89.0 | 91.0 | -10.0 | 54.0 | 23.0 | 23.0 | 30.0 | 16.0 |
| 195 | ILMN | 399.0 | 1022.0 | -0.74 | 407.0 | 8.14 | HAMMER HIKKAKE | 2.0 | Bullish | No | No | Yes | No | No | No | 47.0 | 47.0 | -7.0 | 55.0 | 56.0 | -44.0 | 46.0 | 23.0 | 12.0 | 20.0 | 27.0 |
| 196 | ILPT | 24.79 | 223.0 | 0.2 | 5.0 | 4.38 | BELTHOLD | -1.0 | Bearish | No | No | No | No | No | No | 75.0 | 68.0 | 25.0 | 89.0 | 92.0 | -10.0 | 63.0 | 24.0 | 21.0 | 27.0 | 10.0 |
| 197 | IMAC | 1.68 | 93.0 | -3.45 | 0.0 | 1.2 | HIKKAKE | 1.0 | Bullish | No | No | No | No | No | No | 79.0 | 44.0 | -13.0 | 42.0 | 46.0 | -57.0 | 44.0 | 22.0 | 18.0 | 14.0 | 20.0 |
| 198 | IMMR | 8.93 | 406.0 | -1.33 | 3.0 | -4.8 | 3OUTSIDE | -1.0 | Bearish | No | No | No | No | No | No | 37.0 | 36.0 | -24.0 | 18.0 | 27.0 | -81.0 | 45.0 | 22.0 | 26.0 | 13.0 | 25.0 |
| 199 | IMUX | 14.21 | 233.0 | -7.97 | 3.0 | -3.0 | ENGULFING | -1.0 | Bearish | No | No | No | No | No | Yes | 45.0 | 43.0 | -9.0 | 12.0 | 30.0 | -87.0 | 42.0 | 23.0 | 7.0 | 20.0 | 21.0 |
| 200 | IMVT | 15.42 | 528.0 | -2.9 | 8.0 | 2.8 | BELTHOLD | -1.0 | Bearish | No | No | No | No | No | No | 47.0 | 40.0 | -18.0 | 24.0 | 42.0 | -75.0 | 47.0 | 21.0 | 27.0 | 20.0 | 32.0 |
| 201 | IMXI | 14.87 | 63.0 | -0.93 | 0.0 | -0.4 | BELTHOLD HIKKAKE | -2.0 | Bearish | No | No | No | No | No | No | 51.0 | 45.0 | -10.0 | 36.0 | 34.0 | -63.0 | 42.0 | 23.0 | 7.0 | 18.0 | 18.0 |
| 202 | INBK | 34.8 | 19.0 | 1.72 | 0.0 | -2.96 | DOJI HARAMI HARAMICROSS HIGHWAVE HIKKAKE LONGLEGGEDDOJI RICKSHAWMAN SPINNINGTOP | 6.0 | Bullish | No | No | No | No | No | No | 41.0 | 46.0 | -5.0 | 37.0 | 29.0 | -62.0 | 42.0 | 23.0 | 14.0 | 18.0 | 22.0 |
| 203 | INCY | 82.68 | 966.0 | -0.62 | 79.0 | 3.05 | ENGULFING | -1.0 | Bearish | No | No | No | No | No | No | 51.0 | 54.0 | 2.0 | 73.0 | 77.0 | -26.0 | 48.0 | 24.0 | 11.0 | 22.0 | 21.0 |
| 204 | INDB | 82.52 | 62.0 | 0.7 | 5.0 | -2.76 | SPINNINGTOP | -1.0 | Bearish | No | No | No | No | No | No | 29.0 | 41.0 | -17.0 | 26.0 | 21.0 | -73.0 | 39.0 | 23.0 | 23.0 | 14.0 | 25.0 |
| 205 | INFI | 2.98 | 853.0 | -3.25 | 2.0 | -1.32 | HIKKAKE | 1.0 | Bullish | No | No | No | No | No | No | 40.0 | 43.0 | -5.0 | 9.0 | 23.0 | -90.0 | 40.0 | 23.0 | 9.0 | 20.0 | 25.0 |
| 206 | INFN | 9.88 | 913.0 | -2.08 | 9.0 | 3.02 | BELTHOLD CLOSINGMARUBOZU ENGULFING LONGLINE MARUBOZU | -5.0 | Bearish | No | No | No | No | No | No | 39.0 | 49.0 | 4.0 | 45.0 | 59.0 | -54.0 | 50.0 | 23.0 | 11.0 | 25.0 | 22.0 |
| 207 | INGN | 65.73 | 128.0 | 0.43 | 8.0 | 29.93 | None | 0.0 | None | No | No | No | No | No | No | 86.0 | 83.0 | 41.0 | 95.0 | 96.0 | -4.0 | 78.0 | 25.0 | 30.0 | 44.0 | 8.0 |
| 208 | INMD | 87.31 | 578.0 | -0.06 | 50.0 | 23.15 | None | 0.0 | None | No | No | No | No | No | No | 96.0 | 74.0 | 33.0 | 94.0 | 94.0 | -5.0 | 63.0 | 23.0 | 22.0 | 34.0 | 13.0 |
| 209 | INO | 8.74 | 8815.0 | -3.0 | 77.0 | -0.79 | HIGHWAVE SPINNINGTOP | -2.0 | Bearish | No | No | No | No | No | No | 67.0 | 41.0 | -18.0 | 29.0 | 37.0 | -70.0 | 34.0 | 22.0 | 14.0 | 28.0 | 24.0 |
| 210 | INOV | 29.78 | 500.0 | -0.87 | 14.0 | 7.51 | ENGULFING | -1.0 | Bearish | No | No | No | No | No | No | 66.0 | 64.0 | 35.0 | 72.0 | 77.0 | -27.0 | 58.0 | 23.0 | 30.0 | 28.0 | 15.0 |
| 211 | INSE | 8.84 | 26.0 | 1.49 | 0.0 | -4.33 | ENGULFING | 1.0 | Bullish | No | No | No | No | No | No | 77.0 | 48.0 | 0.0 | 34.0 | 32.0 | -65.0 | 41.0 | 23.0 | 13.0 | 19.0 | 20.0 |
| 212 | INSG | 8.89 | 1713.0 | 1.08 | 15.0 | -8.02 | None | 0.0 | None | No | No | No | No | No | No | 38.0 | 34.0 | -30.0 | 20.0 | 12.0 | -79.0 | 51.0 | 21.0 | 38.0 | 13.0 | 32.0 |
| 213 | INTG | 36.03 | 1.0 | 1.11 | 0.0 | -5.1 | BELTHOLD | 1.0 | Bullish | No | No | No | No | No | No | 56.0 | 45.0 | -6.0 | 47.0 | 35.0 | -52.0 | 48.0 | 23.0 | 16.0 | 28.0 | 26.0 |
| 214 | INVA | 11.9 | 276.0 | 0.08 | 3.0 | 0.08 | None | 0.0 | None | No | No | No | No | No | No | 49.0 | 49.0 | -1.0 | 34.0 | 31.0 | -65.0 | 44.0 | 25.0 | 15.0 | 23.0 | 22.0 |
| 215 | INZY | 18.6 | 36.0 | -7.23 | 0.0 | 1.47 | ENGULFING | -1.0 | Bearish | No | No | No | No | No | No | 51.0 | 43.0 | -8.0 | 23.0 | 36.0 | -76.0 | 40.0 | 25.0 | 11.0 | 21.0 | 15.0 |
| 216 | IONS | 40.78 | 1789.0 | -0.61 | 72.0 | -8.79 | 3OUTSIDE SPINNINGTOP | -2.0 | Bearish | No | No | No | No | No | No | 33.0 | 32.0 | -31.0 | 7.0 | 12.0 | -92.0 | 36.0 | 23.0 | 30.0 | 19.0 | 38.0 |
| 217 | IOVA | 30.14 | 2069.0 | -0.95 | 62.0 | 1.69 | CLOSINGMARUBOZU LONGLINE | -2.0 | Bearish | No | No | No | No | No | No | 68.0 | 40.0 | -21.0 | 38.0 | 39.0 | -61.0 | 32.0 | 22.0 | 26.0 | 23.0 | 20.0 |
| 218 | IPHA | 4.4 | 2.0 | 0.0 | 0.0 | 2.56 | SHORTLINE | 1.0 | Bullish | No | No | No | No | No | No | 56.0 | 50.0 | -3.0 | 69.0 | 68.0 | -30.0 | 49.0 | 24.0 | 19.0 | 16.0 | 29.0 |
| 219 | IQ | 15.22 | 24767.0 | 0.33 | 376.0 | -11.56 | HAMMER | 1.0 | Bullish | No | No | No | No | No | No | 24.0 | 30.0 | -34.0 | 12.0 | 9.0 | -87.0 | 28.0 | 25.0 | 39.0 | 11.0 | 36.0 |
| 220 | IRIX | 7.71 | 141.0 | 3.07 | 1.0 | 10.14 | None | 0.0 | None | No | No | No | No | No | No | 57.0 | 62.0 | 14.0 | 93.0 | 81.0 | -6.0 | 52.0 | 22.0 | 46.0 | 27.0 | 8.0 |
| 221 | IROQ | 22.03 | 0.0 | -2.69 | 0.0 | 3.19 | BELTHOLD CLOSINGMARUBOZU LONGLINE MARUBOZU | -4.0 | Bearish | No | No | No | No | No | No | 92.0 | 54.0 | 12.0 | 68.0 | 86.0 | -31.0 | 47.0 | 26.0 | 14.0 | 28.0 | 23.0 |
| 222 | IRWD | 10.61 | 1002.0 | -2.12 | 10.0 | -3.11 | BELTHOLD ENGULFING LONGLINE | -3.0 | Bearish | No | No | No | No | No | No | 32.0 | 49.0 | -1.0 | 48.0 | 55.0 | -51.0 | 57.0 | 23.0 | 17.0 | 23.0 | 19.0 |
| 223 | ISEE | 5.95 | 398.0 | -3.57 | 2.0 | 1.71 | CLOSINGMARUBOZU ENGULFING EVENINGSTAR LONGLINE | -4.0 | Bearish | No | No | No | No | No | No | 39.0 | 47.0 | -4.0 | 36.0 | 46.0 | -63.0 | 41.0 | 23.0 | 9.0 | 21.0 | 22.0 |
| 224 | ISIG | 4.88 | 40.0 | -0.41 | 0.0 | -14.08 | DOJI HIGHWAVE LONGLEGGEDDOJI MATCHINGLOW RICKSHAWMAN SHORTLINE SPINNINGTOP | 1.0 | Bullish | No | No | No | No | No | No | 75.0 | 33.0 | -21.0 | 1.0 | 0.0 | -98.0 | 22.0 | 25.0 | 20.0 | 31.0 | 24.0 |
| 225 | ISTR | 21.15 | 27.0 | -0.38 | 0.0 | 1.05 | BELTHOLD | -1.0 | Bearish | No | No | No | No | No | No | 43.0 | 57.0 | 10.0 | 77.0 | 74.0 | -22.0 | 63.0 | 23.0 | 24.0 | 21.0 | 12.0 |
| 226 | MPWR | 378.62 | 252.0 | -0.77 | 95.0 | 10.52 | None | 0.0 | None | No | Yes | No | No | No | No | 69.0 | 57.0 | 12.0 | 84.0 | 87.0 | -15.0 | 55.0 | 22.0 | 18.0 | 24.0 | 15.0 |
| 227 | NBLX | 14.27 | 283.0 | -0.49 | 4.0 | -2.79 | DOJI HIGHWAVE LONGLEGGEDDOJI SPINNINGTOP | 4.0 | Bullish | No | No | No | No | No | No | 48.0 | 47.0 | -2.0 | 26.0 | 36.0 | -73.0 | 45.0 | 22.0 | 13.0 | 19.0 | 19.0 |
| 228 | NBRV | 1.5 | 1258.0 | -4.46 | 1.0 | -7.98 | TASUKIGAP | 1.0 | Bullish | No | No | No | No | No | No | 40.0 | 36.0 | -25.0 | 20.0 | 23.0 | -79.0 | 38.0 | 23.0 | 25.0 | 15.0 | 24.0 |
| 229 | NFLX | 546.54 | 3022.0 | -0.49 | 1651.0 | 6.46 | HIKKAKE | 1.0 | Bullish | No | No | No | No | No | No | 74.0 | 55.0 | 11.0 | 76.0 | 76.0 | -23.0 | 53.0 | 23.0 | 17.0 | 23.0 | 20.0 |
| 230 | NICE | 237.64 | 130.0 | 0.09 | 30.0 | 9.67 | DOJI DRAGONFLYDOJI HANGINGMAN LONGLEGGEDDOJI SPINNINGTOP TAKURI | 2.0 | Bullish | No | No | No | No | No | No | 56.0 | 57.0 | 2.0 | 97.0 | 93.0 | -2.0 | 65.0 | 23.0 | 18.0 | 21.0 | 22.0 |
| 231 | NICK | 10.58 | 4.0 | 0.09 | 0.0 | 1.24 | None | 0.0 | None | No | No | Yes | No | No | No | 38.0 | 53.0 | 2.0 | 52.0 | 61.0 | -47.0 | 45.0 | 21.0 | 23.0 | 29.0 | 15.0 |
| 232 | NKLA | 10.98 | 13159.0 | 3.29 | 144.0 | -21.79 | None | 0.0 | None | No | No | No | No | No | No | 21.0 | 29.0 | -36.0 | 13.0 | 6.0 | -86.0 | 36.0 | 23.0 | 33.0 | 12.0 | 34.0 |
| 233 | NKTR | 19.0 | 1666.0 | -1.86 | 31.0 | -2.61 | None | 0.0 | None | No | No | No | No | No | No | 45.0 | 40.0 | -19.0 | 31.0 | 37.0 | -68.0 | 36.0 | 23.0 | 18.0 | 16.0 | 22.0 |
| 234 | NKTX | 34.87 | 255.0 | -4.93 | 8.0 | 11.3 | BELTHOLD ENGULFING HIKKAKE | -1.0 | Bearish | No | No | No | No | No | No | 66.0 | 42.0 | -24.0 | 63.0 | 74.0 | -36.0 | 53.0 | 22.0 | 31.0 | 14.0 | 22.0 |
| 235 | NMFC | 12.99 | 281.0 | 0.46 | 3.0 | 3.1 | HIKKAKE SHOOTINGSTAR | -2.0 | Bearish | No | No | No | No | No | No | 53.0 | 59.0 | 12.0 | 85.0 | 78.0 | -14.0 | 48.0 | 23.0 | 19.0 | 22.0 | 13.0 |
| 236 | NMIH | 23.13 | 510.0 | 1.05 | 11.0 | -0.17 | ENGULFING SHORTLINE | 2.0 | Bullish | No | No | No | No | No | No | 59.0 | 48.0 | -5.0 | 50.0 | 44.0 | -49.0 | 50.0 | 22.0 | 15.0 | 17.0 | 22.0 |
| 237 | NOVN | 1.1 | 4522.0 | -7.56 | 4.0 | -31.25 | DOJI DOJISTAR HIGHWAVE LONGLEGGEDDOJI RICKSHAWMAN SPINNINGTOP | 6.0 | Bullish | No | No | No | No | No | No | 35.0 | 32.0 | -16.0 | 4.0 | 4.0 | -95.0 | 35.0 | 21.0 | 19.0 | 12.0 | 30.0 |
| 238 | NRBO | 3.23 | 107.0 | -12.47 | 0.0 | -24.18 | LONGLINE | -1.0 | Bearish | No | No | No | No | No | No | 26.0 | 25.0 | -28.0 | 2.0 | 8.0 | -97.0 | 32.0 | 23.0 | 14.0 | 14.0 | 31.0 |
| 239 | NRC | 47.3 | 15.0 | 0.4 | 0.0 | 1.76 | HANGINGMAN | -1.0 | Bearish | No | No | No | No | No | No | 63.0 | 47.0 | -10.0 | 55.0 | 47.0 | -44.0 | 38.0 | 23.0 | 16.0 | 16.0 | 20.0 |
| 240 | NRIM | 42.79 | 10.0 | 0.05 | 0.0 | 0.05 | MATCHINGLOW | 1.0 | Bullish | No | No | Yes | No | No | No | 42.0 | 50.0 | 4.0 | 43.0 | 50.0 | -56.0 | 49.0 | 23.0 | 19.0 | 16.0 | 17.0 |
| 241 | NSEC | 11.0 | 0.0 | -3.85 | 0.0 | 4.76 | None | 0.0 | None | No | No | No | No | No | No | 60.0 | 49.0 | -3.0 | 44.0 | 50.0 | -55.0 | 43.0 | 27.0 | 11.0 | 38.0 | 35.0 |
| 242 | NSSC | 33.21 | 50.0 | 0.06 | 1.0 | -3.15 | MATCHINGLOW | 1.0 | Bullish | No | No | No | No | No | No | 33.0 | 45.0 | 3.0 | 8.0 | 19.0 | -91.0 | 48.0 | 25.0 | 14.0 | 18.0 | 22.0 |
| 243 | NTEC | 3.83 | 101.0 | -3.28 | 0.0 | -8.37 | None | 0.0 | None | No | No | No | No | No | No | 35.0 | 40.0 | -9.0 | 3.0 | 17.0 | -96.0 | 31.0 | 21.0 | 11.0 | 18.0 | 22.0 |
| 244 | NTES | 106.8 | 1202.0 | 0.91 | 128.0 | 3.79 | None | 0.0 | None | No | No | No | No | No | No | 65.0 | 50.0 | -6.0 | 67.0 | 67.0 | -32.0 | 55.0 | 22.0 | 14.0 | 25.0 | 27.0 |
| 245 | NTGR | 39.27 | 345.0 | 0.56 | 13.0 | -2.72 | DOJI HARAMI HARAMICROSS HIGHWAVE LONGLEGGEDDOJI RICKSHAWMAN SPINNINGTOP | 7.0 | Bullish | No | No | No | No | No | No | 33.0 | 40.0 | -9.0 | 15.0 | 15.0 | -84.0 | 48.0 | 23.0 | 9.0 | 16.0 | 24.0 |
| 246 | NTLA | 70.45 | 889.0 | -5.78 | 62.0 | -2.48 | BELTHOLD LONGLINE | -2.0 | Bearish | No | No | No | No | No | No | 57.0 | 50.0 | 9.0 | 35.0 | 53.0 | -64.0 | 52.0 | 24.0 | 11.0 | 25.0 | 25.0 |
| 247 | NTNX | 27.34 | 1988.0 | -4.0 | 54.0 | 5.72 | BELTHOLD CLOSINGMARUBOZU LONGLINE MARUBOZU | -4.0 | Bearish | No | No | No | No | No | No | 53.0 | 47.0 | -5.0 | 58.0 | 78.0 | -41.0 | 51.0 | 22.0 | 15.0 | 22.0 | 21.0 |
| 248 | NUVA | 69.02 | 410.0 | 0.1 | 28.0 | 5.78 | SHOOTINGSTAR | -1.0 | Bearish | No | No | No | No | No | No | 54.0 | 65.0 | 25.0 | 79.0 | 84.0 | -20.0 | 58.0 | 23.0 | 27.0 | 26.0 | 10.0 |
| 249 | NVAX | 227.35 | 4434.0 | 12.5 | 1008.0 | 31.17 | CLOSINGMARUBOZU ENGULFING LONGLINE | 3.0 | Bullish | No | No | No | No | No | No | 68.0 | 62.0 | -1.0 | 98.0 | 86.0 | -1.0 | 60.0 | 22.0 | 18.0 | 30.0 | 20.0 |
| 250 | NVCR | 192.5 | 1118.0 | -3.18 | 215.0 | 53.69 | HARAMI | -1.0 | Bearish | No | No | No | No | No | No | 79.0 | 69.0 | 24.0 | 73.0 | 73.0 | -26.0 | 65.0 | 24.0 | 35.0 | 48.0 | 9.0 |
| 251 | NVEE | 93.93 | 48.0 | -0.02 | 4.0 | -1.67 | None | 0.0 | None | No | No | No | No | No | No | 43.0 | 47.0 | -3.0 | 21.0 | 36.0 | -78.0 | 38.0 | 23.0 | 9.0 | 17.0 | 18.0 |
| 252 | NWBI | 14.27 | 272.0 | 0.21 | 3.0 | -2.73 | SPINNINGTOP | -1.0 | Bearish | No | No | No | No | No | No | 38.0 | 44.0 | -5.0 | 29.0 | 28.0 | -70.0 | 50.0 | 24.0 | 15.0 | 18.0 | 25.0 |
- The table is used to find today’s top gainers, top loser, top money flow, most active, golden crosses, death crosses, bullish, bearish, overbought, oversold, trend strength, direction, etc.
- Sort the table by click the coresponding column of the table to find what you want from the top rows.
- You can directly input key word to find stocks that match your condition. For example, ‘bullish’, ‘Yes’, ‘2CROWS’, ‘3BLACKCROWS’, etc.
- Followings are brief descriptions of each column:
- Symbols: Stock symbol
- Volume: Today’s trading volume (unit:K)
- Close: Today’s close price
- Change: Daily price change percentage (%)
- ROC: The Price Rate of Change (12-day) percentage (%)
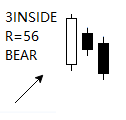
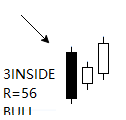
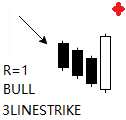
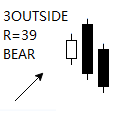
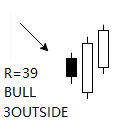
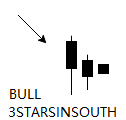
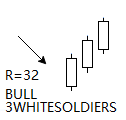
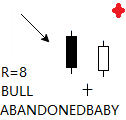
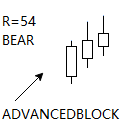
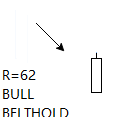
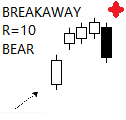
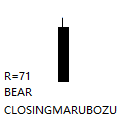
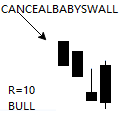
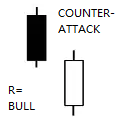
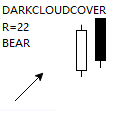
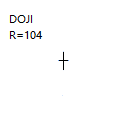
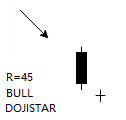
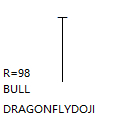
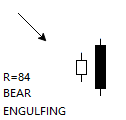
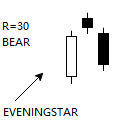
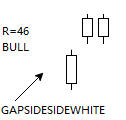
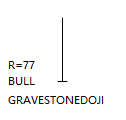
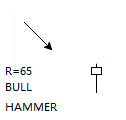
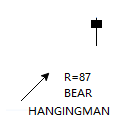
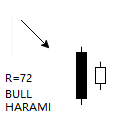
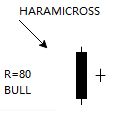
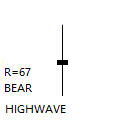
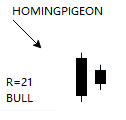
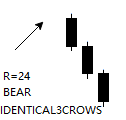
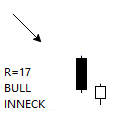
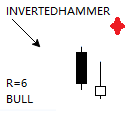
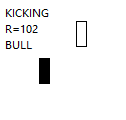
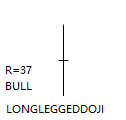
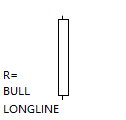
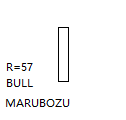
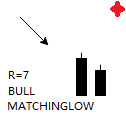
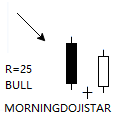
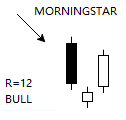
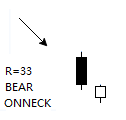
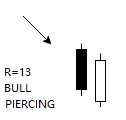
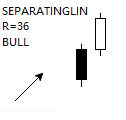
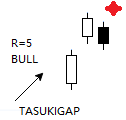
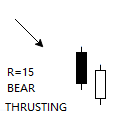
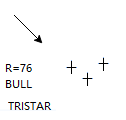
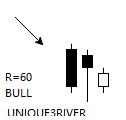
- PATTERN: Matched candlestick pattern names
- BULL: Bullish, Bearish or no pattern
- GLD50: Golden cross, 50-day moving average crossed above 200-day moving aveage within the last 5 days
- GLD20: Golden cross, 20-day moving average crossed above 50-day moving aveage within the last 3 days
- GLD10: Golden cross, 10-day moving average crossed above 20-day moving aveage today
- DIE50: Death cross, 50-day moving average crossed below 200-day moving aveage within the last 5 days
- DIE20: Death cross, 20-day moving average crossed below 50-day moving aveage within the last 3 days
- DIE10: Death cross, 10-day moving average crossed below 20-day moving aveage today
- MF: Money flow = Close * Volume (unit:K)
- MFI: Money Flow Index.Above 80 is considered overbought and below 20 is considered oversold.
- RSI:Relative Strength Index (%). Above 70% is considered overbought and below 30% is considered oversold.
- TSI:True Strength Index. >0 the bulls are more in control. <0 the bears are more in control.
- SR: Stochastic RSI. Above 80 is overbought, and below 20 is oversold.
- SRs: Stochastic RSI signal.
- WR:Williams %R. Above -20 is considered overbought and below -80 is considered oversold.
- UO:Ultimate Oscillator.Follows the three-step approach.
- MI:Mass Index.Above 27 – creating a “bulge” – and then drops below 26.5, the stock is ready to change course.
- ADX:Average Directional Movement Index.Above 25 is considered the trend has strength. Below 20 is considered the trend is weak or the price is trendless.
- ADX+: ADX+ is above ADX- when price is moving up.
- ADX-: ADX- is above ADX+ when price is moving down.